Pregnancy-Associated Biomarker Changes Are Not Equivalent to Biological Aging
A critical review of the postpartum recovery hypothesis and an independent restricted reanalysis of DunedinPACE
Kai Weng2 · Bomi Joseph, MD, PhD1,*
1 Peak Health Center, San Francisco, California, United States · ROR: 04b23x642
2 James Cook University, Singapore · ROR: 04gsp2c11
ORCID: Bomi Joseph 0000-0001-7626-2734 · Kai Weng 0009-0009-4186-0991
*Corresponding author: Kai Weng · kweng@alkemyindex.com
Submitted September 30, 2026 · Published October 26, 2026
DOI: 10.5281/zenodo.23630711
Abstract
BACKGROUND:
Pregnancy involves profound endocrine, metabolic, immunological, and cardiovascular adaptation. Recent work has interpreted shifts in epigenetic age estimators during gestation and postpartum as accelerated biological aging and recovery.
OBJECTIVE:
To evaluate the evidentiary basis for that interpretation and examine the principal DunedinPACE finding using traceable complete records.
METHODS:
We critically evaluated the Albright–Poganik hypothesis and five relevant studies, and examined Etzel et al.’s article, supplementary documentation, and available longitudinal workbook.
RESULTS:
The original study reported a significant DunedinPACE later-pregnancy-by-time spline interaction (approximately β=0.196, p=0.006), whereas corresponding interactions for three other biomarkers were nonsignificant. In the supplied workbook, 21 rows contained DunedinPACE values at all three nominal visits. Unadjusted paired prenatal-to-final change was −0.0089 (95% CI −0.1602 to 0.1425; p=0.904). However, absent original subject identifiers and uncertain pregnancy-indicator mappings prevented exact reproduction of the published interaction.
CONCLUSIONS:
Reproductive-state-dependent changes in aging estimators do not alone establish cumulative biological deterioration. The postpartum recovery hypothesis requires direct functional validation and more transparent reproducibility of its central statistical result.
1. INTRODUCTION
Pregnancy is a physiological transition characterized by coordinated changes in endocrine signaling, immune function, plasma volume, renal filtration, coagulation, and nutrient allocation. Many of these measurements also correlate with age in nonpregnant populations. A change in the same direction does not imply the same underlying biological mechanism.
Albright and Poganik [1] hypothesize that the extent of postpartum recovery, particularly before another pregnancy, determines cumulative maternal biological aging. This is a testable hypothesis, but the inference from an age-correlated molecular signal to lasting organismal deterioration requires evidence that the measurement is valid during pregnancy and predicts durable functional decline. Our objective is to distinguish demonstrated biomarker changes from claims about underlying aging processes.
2. METHODS AND SCOPE
This is a focused critical review, not a systematic review or meta-analysis. The evidence base comprises the Albright–Poganik review [1], Etzel et al. [2], Poganik et al. [3], Moran et al. [4], Ying et al. [5], Gurven et al. [6], and Sehgal et al. [7]. The full versions and Etzel supplemental documentation supplied for this project were examined. We did not independently verify every cited primary study in the hypothesis review.
For independent reanalysis, we used Trajectories_Data.xlsx, supplemental mmc1.pdf, and regression summaries in mmc3.xlsx. The workbook is wide-format: measurements at three nominal visits occur in the same row. We used original worksheet rows as provisional longitudinal identifiers, without asserting independent verification of uniqueness against the source cohort. We restricted paired comparisons to rows with non missing DunedinPACE at all three time points, without imputation, cell-composition residualization, or reclassification of pregnancy indicators. Paired t-tests and 95% confidence intervals were calculated on within-row differences. These tests do not reproduce the published adjusted natural-spline interaction.
3. EPIGENETIC AGE PREDICTION VERSUS BIOLOGICAL AGING

A statistical clock trained to predict chronological age or an age-associated physiological composite is not automatically specific to irreversible biological deterioration. Pregnancy can alter clock inputs through adaptive endocrine regulation, immune-cell composition, and tissue-specific molecular remodeling. The inferential chain from altered methylation to altered clock output, then to accelerated biological aging, and finally to cumulative maternal damage requires validation at each transition.
Ying et al. [5] distinguish methylation changes inferred to be damaging from changes inferred to be protective, and report that conventional clocks were not significantly enriched for CpG sites inferred to causally affect the examined lifespan/healthspan traits. Their Mendelian randomization approach has assumptions and limitations; nonetheless, it shows why age prediction alone cannot establish damage.
3.1. SEHGAL ET AL. (2026): DUNEDINPACE RESPONSIVENESS AND PHYSIOLOGICAL-STATE DEPENDENCE
Sehgal et al. [7] evaluated 16 epigenetic clocks and 94 additional DNA methylation biomarkers across 51 longitudinal intervention studies. DunedinPACE showed significant decreases in 16 interventions and an increase in one, demonstrating that its output is responsive to changing physiological conditions. The authors noted that changes in composite epigenetic biomarkers may reflect intermediate health or inflammatory states rather than direct alterations in aging biology. This distinction is central to the present critique: cytokine activity, immune-cell composition, endocrine signaling, and metabolic regulation may vary during pregnancy and return toward baseline during recovery. A corresponding change in a methylation-derived pace estimate does not, by itself, demonstrate acceleration and reversal of organismal aging. Sehgal et al. did not conclude that methylation is unrelated to aging; rather, their findings underscore the need to validate what a changing clock output measures in each physiological context. In pregnancy, independent evidence of persistent functional deterioration is required before a clock response can be interpreted as accelerated biological aging.
3.2. AGING IS DIRECTIONAL: THE CONCEPTUAL INCONSISTENCY IN INTERPRETING REVERSIBLE BIOMARKER CHANGES
A fundamental distinction must be maintained between biological aging and reversible physiological change. Aging, understood as the progressive accumulation of age-associated deterioration and loss of physiological capacity, is a directional process. In contrast, physiological adaptation, homeostatic regulation, inflammatory responses, endocrine transitions, and recovery are dynamic processes that may fluctuate over periods ranging from hours to years.
This distinction is particularly relevant to the conceptual framework advanced by Poganik and colleagues.
In Aging vs. Biological Age: Conceptual Considerations for Age Reversal Claims (2026), Poganik et al. explicitly distinguish the underlying biological aging process from measurements of biological age. Their conceptual discussion recognizes the importance of defining what constitutes aging, rather than assuming that changes in an aging-associated biomarker necessarily represent changes in the aging process itself.
However, the postpartum recovery hypothesis advanced by Albright and Poganik (2026) interprets pregnancy-associated increases in biological-age estimates and their subsequent postpartum normalization within a framework of accelerated maternal aging, rejuvenation, and potentially cumulative aging resulting from incomplete recovery.
These interpretations raise a fundamental question of conceptual consistency.
If a biological-age estimator increases during pregnancy and decreases following childbirth, what precisely has aged and subsequently become younger?
A reversible change in DNA methylation, cytokine signaling, immune-cell composition, endocrine activity, or metabolic regulation does not, by itself, establish the accumulation or reversal of age-associated biological deterioration. Such changes may instead represent normal physiological responses to pregnancy and their subsequent resolution.
Consider inflammation. Cytokine concentrations can increase in response to physiological stress and decline as the inflammatory response resolves. This temporal variation reflects inflammatory regulation and recovery. It does not establish that the individual has biologically aged during the inflammatory response and subsequently reversed aging when cytokine activity subsides.
The same inferential limitation applies to methylation-derived aging estimators. Their responsiveness to changing physiological conditions does not establish that the underlying organismal aging process is moving forward and backward.
Aging and recovery must therefore be distinguished operationally. Under a definition of aging as progressive, persistent deterioration, a reversible biomarker fluctuation cannot itself constitute evidence of aging. A transient biological response may coexist with aging, but it should not be classified as aging without independent evidence connecting it to the underlying deterioration process.
This distinction does not exclude the possibility that pregnancy complications or repeated physiological stressors produce lasting biological damage. Rather, it requires such damage to be demonstrated independently instead of inferred from temporary changes in aging-associated measurements.
The conceptual distinction between aging and biological-age estimation articulated by Poganik et al. should be applied consistently when interpreting pregnancy-associated biomarker trajectories. Without that consistency, the postpartum recovery hypothesis risks conflating physiological adaptation and recovery with accelerated aging and rejuvenation.
A measurement that rises and falls with physiological state cannot, solely on that basis, establish a corresponding acceleration and reversal of biological aging.
4. APPRAISAL OF ETZEL ET AL.: THE EVIDENTIARY FOUNDATION OF THE POSTPARTUM HYPOTHESIS
Albright and Poganik [1] cite Etzel et al. [2] in support of a postpartum recovery-window hypothesis linking subsequent pregnancy to altered maternal biological-age trajectories. The evidentiary chain requires careful separation of (i) measured longitudinal biomarker changes, (ii) a modeled pregnancy-by-time interaction, and (iii) an inference of persistent biological aging. Etzel et al. provide evidence for the first two under their analysis choices, but their data do not directly demonstrate the third.
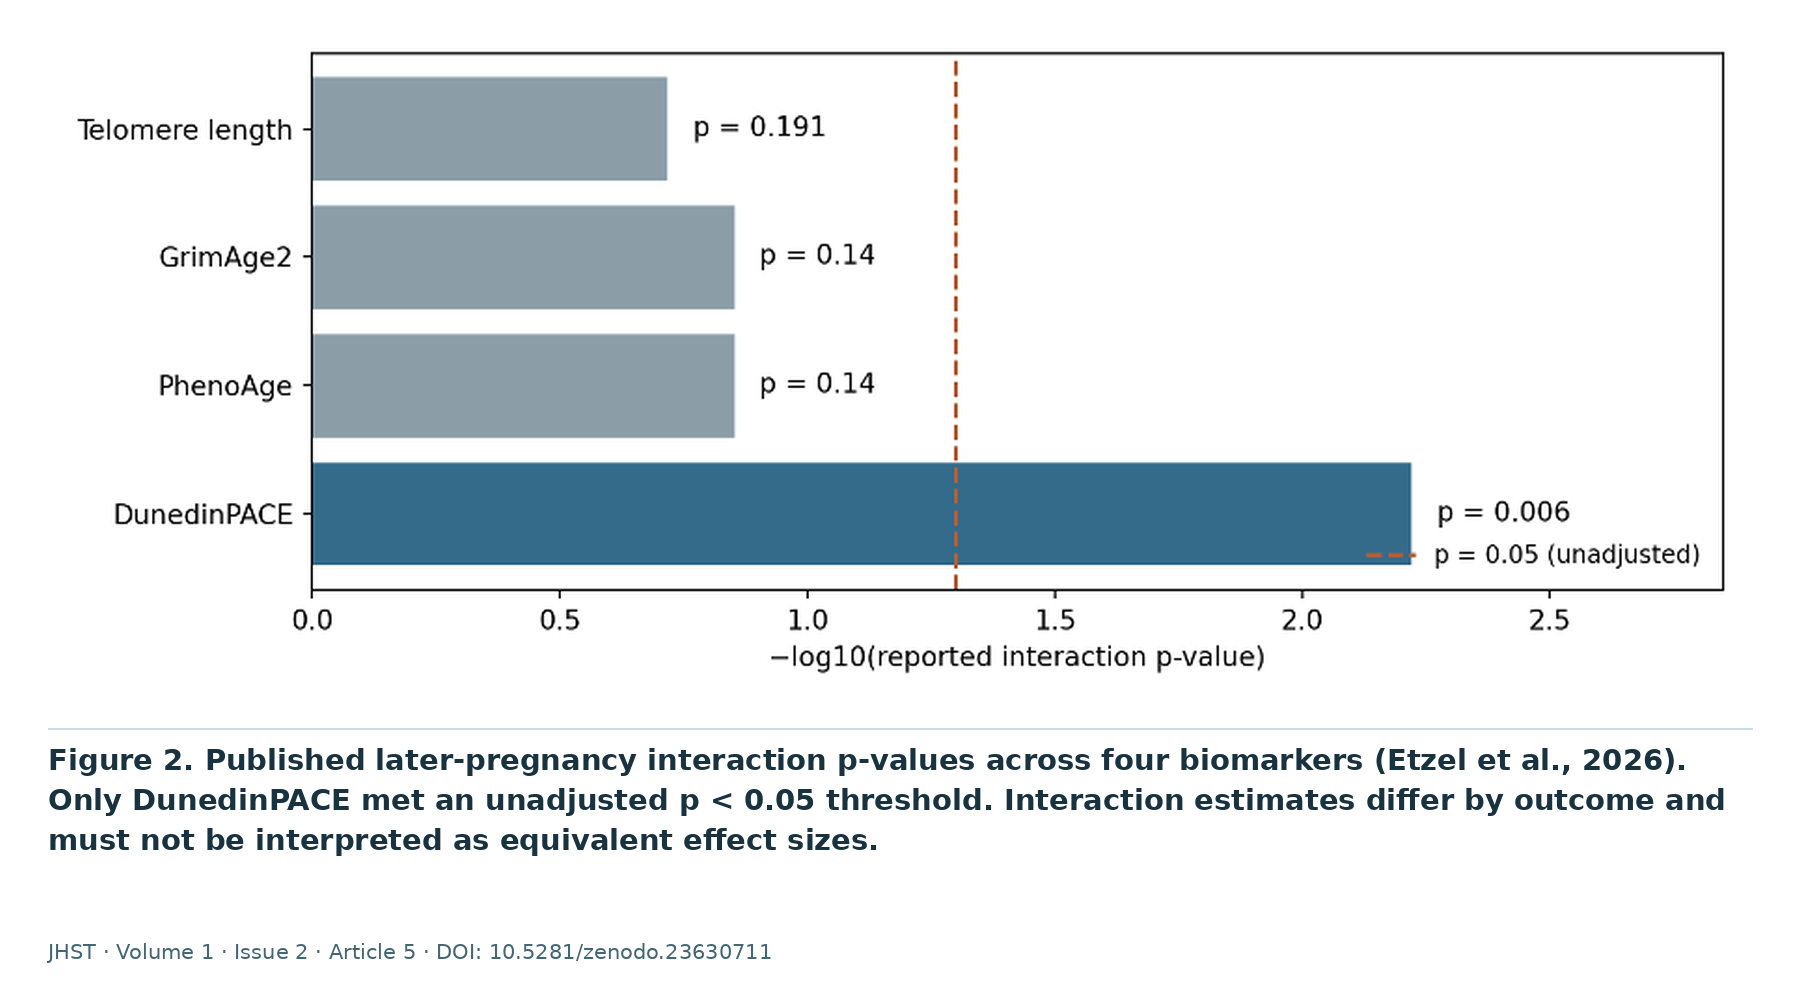
4.1. FOUR BIOMARKERS DO NOT PROVIDE FOUR INDEPENDENT CONFIRMATIONS
Among the reported later-pregnancy interactions, DunedinPACE alone met the conventional unadjusted 0.05 significance threshold. Telomere length, GrimAge2 and PhenoAge did not. Non-significance is not proof of zero association, and differences among outcomes may reflect
| Outcome | Reported interaction p | Interpretation |
|---|---|---|
| DunedinPACE | 0.006 | Significant selected spline-basis interaction |
| Telomere length | 0.191 | No statistically significant corresponding interaction |
| GrimAge2 | ~0.14 | No statistically significant corresponding interaction |
| PhenoAge | ~0.14 | No statistically significant corresponding interaction |
Table 1. Values reported in the current manuscript from Etzel supplemental regression results. These p-values are not effect sizes, and do not establish absence of an association.
distinct measurement properties. Nonetheless, the three nonsignificant results do not corroborate a shared cumulative-aging trajectory. The hypothesis should therefore not be presented as supported consistently across four aging measures.
4.2. COHORT ATTRITION AND UNVERIFIABLE ANALYSIS LINKAGE
The source study describes 130 participants, but its supplemental table identifies 45 with observations at all three visits, including six of 19 participants classified as having a later subsequent pregnancy. The separately disclosed wide-format trajectory workbook contains only 21 rows with DunedinPACE present at all three nominal visits. These counts refer to different levels of completeness and should not be conflated. In that workbook, visit-specific measurements occupy the same row, supporting provisional within-row linkage. However, no original subject identifier (FamID) is supplied, and the fields AddPreg_T18, AddPreg_T30, and AddPreg_T36 cannot be mapped unambiguously to the published PregAgain_Late classification. Accordingly, independent reviewers cannot establish unique original identities or exactly reproduce the key exposure grouping from that workbook alone.

4.3. THE MODEL COEFFICIENT IS NOT AN AGING-RATE EFFECT
The reported DunedinPACE result is a second natural-spline-basis-by-later-pregnancy interaction (approximately β=0.196, SE=0.072, p=0.006). A spline-basis coefficient describes a component of a fitted time-dependent group contrast; it is not directly interpretable as a 19.6% increase in aging, a change in biological years, or permanent biological deterioration. The result requires fitted marginal trajectories, uncertainty intervals, and explicit outcome preprocessing for meaningful interpretation. Cell-composition residualization, time coding, inclusion criteria, and missing-data assumptions all affect exact reproducibility.
The study lacks a non-pregnant comparator and postpartum BMI; later-pregnancy gestational age was not standardized. Saliva has variable epithelial and immune-cell content. The authors used reference-free deconvolution and imputed CpG values missing from the EPICv2 array. These decisions require careful validation when applying predominantly blood-trained clocks to pregnancy-associated tissue changes.
Poganik et al. [3] show that several biological-age estimates can change during stress and return toward baseline after recovery. This demonstrates responsiveness but does not distinguish restoration of biological function from normalization of stress-responsive clock inputs. If an algorithm reports that a woman has aged during pregnancy and become younger after childbirth, the first scientific question is not how she reversed aging. It is whether the algorithm was measuring aging in the first place.
Moran et al. [4] analyzed laboratory measurements across approximately 313,000 pregnancies and a large non-pregnant reference population. They show that apparent laboratory age can fall early in gestation, rise toward delivery, and return toward baseline. The mechanisms differ: reduced albumin during gestation can reflect hemodilution, while a similar decline in later life may arise from different mechanisms. Pregnancy-associated hypercoagulation may be adaptive, unlike harmful late-life hypercoagulation. Their aggregate cross-sectional design does not establish individual long-term outcomes.
Gurven et al. [6] report no consistent cumulative deterioration in the measured nutritional and immune indices with greater parity or reproductive pace among Tsimane women. They also document meaningful reproductive health burdens and do not assess epigenetic clocks. Their findings challenge universal depletion models but do not prove reproduction has no health costs.
5. INDEPENDENT RESTRICTED DUNEDINPACE RESULTS
5.1. RECORD SELECTION AND ESTIMAND
We selected the 21 rows of Trajectories_Data.xlsx containing nonmissing DunedinPACE_T0, DunedinPACE_T6, and DunedinPACE_T36 values. Original worksheet row numbers were retained as audit keys, not asserted to be verified participant IDs. No imputation, pregnancy-group reconstruction, or cell-composition residualization was performed. We estimated mean within-row changes between visits with paired t-tests and 95% confidence intervals. This estimand is distinct from the original adjusted nonlinear group-by-time interaction.
| Comparison (n=21) | Mean change | 95% CI | Paired p |
|---|---|---|---|
| Prenatal → first | +0.0586 | −0.0637 to +0.1809 | 0.329 |
| First → final | −0.0675 | −0.2096 to +0.0746 | 0.333 |
| Prenatal → final | −0.0089 | −0.1602 to +0.1425 | 0.904 |
Table 2. Previously reported exploratory complete-record DunedinPACE results (n = 21). Unadjusted paired comparisons; these do not test the published nonlinear pregnancy-by-time interaction. Numerical values require final independent code verification.

The supplied trajectory workbook contains 21 within-row-linked records with DunedinPACE values at all three nominal time points. The mean prenatal-to-first follow-up change was +0.0586 (95% CI −0.0637 to +0.1809; paired p=0.329). The mean first-to-final change was −0.0675 (95% CI −0.2096 to +0.0746; p=0.333). The mean prenatal-to-final change was −0.0089 (95% CI −0.1602 to +0.1425; p=0.904). These results do not show a statistically detectable net mean change within the complete-record subset, but do not establish equivalence or absence of an effect.

Among the 21 records, the workbook field AddPreg_T36 was positive for two and negative for 19. Their unadjusted prenatal-to-final mean changes were approximately −0.2828 and +0.0199, respectively (exploratory Welch p≈0.449). AddPreg_T18 was positive for three records, with mean change approximately −0.3565 versus +0.0490 in 18 other records (p≈0.176). These subgroup contrasts are severely underpowered and the fields have not been established as equivalent to the published PregAgain_Late exposure. They cannot be used to infer a protective effect of pregnancy.
The supplemental code specifies mixed models using natural splines, FamID, PregAgain_Late, PregAgain_Early, and covariates. The trajectory workbook does not explicitly supply the same analysis-ready participant IDs or pregnancy classification, and our unadjusted complete-record contrasts do not test the published interaction. The observed difference between our descriptive result and the original interaction therefore cannot be characterized as a demonstrated statistical error. Before publication, a second analyst should reproduce our numeric results and assess whether a separate publicly deposited analysis-ready dataset resolves the linkage gap.
6. DISCUSSION
The empirical evidence supports a reproductive-state-associated change in aging-clock outputs, not a proven acceleration of persistent organismal deterioration. Even exact reproduction of the published DunedinPACE interaction would not establish that its change during pregnancy reflects the same processes as its change in nonpregnant longitudinal aging cohorts.
| Reproducibility dimension | Observed limitation | Consequence |
|---|---|---|
| Participant linkage | Within-row longitudinal data; no explicit original FamID | Original cohort uniqueness cannot be independently checked |
| Exposure definition | Pregnancy indicators not unambiguously mapped to PregAgain_Late | Published interaction cannot be exactly reconstructed |
| Completeness | 21 complete three-visit DunedinPACE rows | Restricted analysis has low exposed-subgroup precision |
| Biological construct | Methylation-derived pace estimator applied in pregnancy | Clock response is not direct evidence of lasting deterioration |
Table 3. Traceability and construct-validity limitations of the disclosed reanalysis materials. These concerns do not themselves establish statistical misconduct or falsification.
The statistical distinction is equally important. A significant time-by-pregnancy spline coefficient is not equivalent to a significant mean difference across all three visits. Conversely, a nonsignificant paired mean change in 21 complete records does not refute the interaction estimated using a larger incomplete-case sample and different covariate adjustments. The restricted analysis identifies uncertainty and limited independent corroboration, not falsification of the authors’ model.
A decisive prospective study would begin before conception, include age-matched nonpregnant controls, standardize gestational and lactation state, measure cell composition, use validated tissue-specific assays, and connect biomarker trajectories to durable functional and clinical outcomes. Interpregnancy interval would need to be modeled alongside health selection, socioeconomic resources, nutritional status, pregnancy complications, and baseline physiology.
This distinction matters for clinical translation. Recommending reproductive spacing on the basis of an unvalidated pregnancy-specific interpretation of a clock could confuse adaptive physiology with damage. Conventional obstetric evidence for pregnancy spacing remains important; the present critique addresses only claims that aging-clock shifts provide an independently validated mechanistic measure of cumulative aging.
The evidentiary basis of the Albright–Poganik postpartum recovery hypothesis warrants particular scrutiny. Etzel et al. reported a statistically significant later-pregnancy-by-time interaction for DunedinPACE, but not for telomere length, GrimAge2, or PhenoAge. The subsequent interpretation of this isolated significant interaction as evidence of cumulative maternal biological aging therefore lacks statistically significant corroboration from the other three examined biomarkers. Our independent examination of the disclosed trajectory workbook further identified incomplete participant traceability, uncertainty in reconstructing the published pregnancy classification, and only 21 complete three-visit DunedinPACE records. Within this restricted subset, the prenatal-to-final mean difference was not statistically significant. Although this analysis does not replicate or refute the original adjusted nonlinear interaction, it provides no independent confirmation of sustained DunedinPACE elevation. More fundamentally, neither the reported interaction nor our restricted analysis independently establishes persistent biological deterioration. Consequently, the evidence presented does not substantiate the broader claim that pregnancy itself constitutes accelerated or cumulative biological aging.

7. LIMITATIONS
This review is focused, not systematic. The reanalysis is restricted to a supplied wide-format workbook rather than the full original study database. Row-level linkage is internally coherent but not independently authenticated. The complete-case sample is small, exposed subgroups are extremely small, and selection bias is possible. The published outcome transformations and pregnancy categories could not be reconstructed exactly from the reviewed workbook. No claim of fabrication, misconduct, or mathematical error is justified by these findings.
8. CONCLUSION
Pregnancy-associated biomarker changes are demonstrable, but equating them with accelerated biological aging is not warranted without independent evidence of lasting functional deterioration. The restricted DunedinPACE analysis does not corroborate a net increase across three visits, while the original study’s sole significant biomarker interaction remains a different, incompletely replicated statistical contrast. The postpartum recovery hypothesis remains plausible as a research question, but its aging interpretation is not established by the available evidence.
DECLARATIONS
Author contributions
Bomi Joseph: Conceptualization, article conception and design and development of the manuscript outline.
Kai Weng: Research and investigation, source identification, collection of supporting documents, compilation of the reference literature and writing of the manuscript.
Both authors reviewed and approved the final manuscript.
Funding
This work was supported by Peak Health Center, San Francisco, California, USA (ROR: https://ror.org/04b23x642).
Competing interests
Bomi Joseph is the inventor of the Deep Health® Device, a health-measurement technology. Kai Weng declares no competing interests.
Data availability
This study presents an independent secondary examination of the supplementary data published by Etzel et al. (2026), Maternal biological aging from pregnancy through four years postpartum with disrupted recovery by subsequent pregnancy, iScience, 29, 116546. DOI: 10.1016/j.isci.2026.116546.
The original supplementary files examined included Trajectories_Data.xlsx and mmc3.xlsx. The accompanying Zenodo dataset, Etzel 2026 — Independent DunedinPACE Reanalysis, provides the extracted longitudinal measurements, a complete-record selection audit, within-record differences, recalculated descriptive statistics, paired statistical comparisons, 95% confidence intervals, and documentation of the analytical methods and limitations.
Of the 264 rows in the disclosed trajectory workbook, 21 contained complete DunedinPACE measurements at all three nominal observation points (T0, T6, and T36). These 21 within-row-linked records formed the basis of the restricted paired analysis.
The disclosed trajectory workbook did not contain explicit original participant identifiers, preventing independent verification of participant uniqueness against the original study cohort. Additionally, the available pregnancy indicators could not be unambiguously mapped to the published later-pregnancy classification. Consequently, the independent analysis does not reproduce the original adjusted nonlinear pregnancy-by-time interaction model.
The secondary analysis detected no statistically significant net prenatal-to-final mean DunedinPACE change in the 21 complete records (mean difference −0.0089; 95% CI −0.1602 to +0.1425; p = 0.904). This finding is limited to the restricted complete-record sample and should not be interpreted as a direct statistical refutation of the published interaction.
The original supplementary datasets remain attributable to Etzel et al. The derived analysis workbook, documentation, and reproducibility information are made available through the accompanying Zenodo record.
Zenodo DOI: 10.5281/zenodo.23630711
Use of artificial-intelligence tools
Artificial-intelligence tools were used in the creation of some of the figures.
REFERENCES
[1] Albright SM, Poganik JR. The postpartum recovery window as a determinant of maternal aging. Trends Endocrinol Metab. 2026. doi:10.1016/j.tem.2026.09.002.
[2] Etzel L, et al. Maternal biological aging from pregnancy through four years postpartum with disrupted recovery by subsequent pregnancy. iScience. 2026;29:116546. doi:10.1016/j.isci.2026.116546.
[3] Poganik JR, et al. Biological age is increased by stress and restored upon recovery. Cell Metab. 2023;35:807–820.e5. doi:10.1016/j.cmet.2023.03.015.
[4] Moran R, Pridham G, Toledano Y, Alon U. Pregnancy lab test dynamics resemble rejuvenation of some organs and aging of others. Nat Commun. 2026;17:2838. doi:10.1038/s41467-026-69340-0.
[5] Ying K, et al. Causal Epigenetic Age Uncouples Damage and Adaptation. bioRxiv preprint. 2022. doi:10.1101/2022.10.07.511382. Published version: Nat Aging. 2024. doi:10.1038/s43587-023-00557-0 (final text not cross-checked against supplied preprint).
[6] Gurven M, et al. Health costs of reproduction are minimal despite high fertility, mortality and subsistence lifestyle. Sci Rep. 2016;6:30056. doi:10.1038/srep30056.
[7] Sehgal R, Borrus D, Armstrong JF, et al. Responsiveness of epigenetic aging biomarkers to longevity interventions in humans. Nat Med. 2026;32:3477–3490. doi:10.1038/s41591-026-04562-9.
[8] Poganik JR, Moldakozhayev A, Justice JN, et al. Aging vs. biological age: Conceptual considerations for age reversal claims. Cell Metabolism. 2026;38(9):1746–1750. DOI: 10.1016/j.cmet.2026.06.015
Etzel 2026 — Independent DunedinPACE Reanalysis
Supporting data for Pregnancy-Associated Biomarker Changes Are Not Equivalent to Biological Aging. All seven sheets of the accompanying workbook are reproduced below, including the 21 complete records and the complete 264-row source audit.
These unadjusted complete-record comparisons do not reproduce the published adjusted nonlinear pregnancy-by-time interaction. Worksheet rows are provisional record keys, not independently verified original participant identities. Empty cells remain empty; visit dates remain Excel serial values.
Article and accompanying dataset · DOI 10.5281/zenodo.23630711
START HERE
Etzel 2026 — Independent Data Examination
Read this sheet first. This workbook distinguishes published regression outputs from independently recalculated complete-record comparisons.
| Section | Contents | How to interpret |
|---|---|---|
| 01 — Key findings | Our paired analysis of 21 complete within-row records | No statistically detectable net prenatal-to-final mean change; not the published spline interaction |
| 02 — Paired tests | Three comparisons, confidence intervals and p-values | Calculated directly from disclosed DunedinPACE_T0/T6/T36 fields |
| 03 — 21 complete records | Exact original row numbers, measurements, differences and pregnancy flags | Worksheet row is a provisional record locator, NOT a verified original participant ID |
| 04 — All records | All 264 rows: DunedinPACE values, completeness and pregnancy indicators | Provides transparent selection audit and preserves missing values |
| 05 — Published models | Transcription of published mmc3.xlsx D. Results interaction coefficients | Published model output; not independently reconstructed |
| 06 — Data dictionary | Field definitions and interpretive cautions | Do not infer pregnancy grouping from AddPreg flags without source code |
| 07 — Methods and limits | Provenance, calculation equations and missing-data restrictions | Important limitations for scientific publication |
Paired tests
Independent complete-record paired DunedinPACE comparisons
Two-sided paired t-tests, df=20; 95% t confidence intervals; these do NOT test the published later-pregnancy × spline interaction.
| Comparison | n | Mean change | SE of change | t statistic | p-value | 95% CI low | 95% CI high | Interpretation |
|---|---|---|---|---|---|---|---|---|
| Prenatal (T0) → first follow-up (T6) | 21 | 0.058643655147514 | 0.0586312130237215 | 1.00021220989897 | 0.329156405354782 | -0.0636589120888273 | 0.180946222383855 | Not significant at 0.05 |
| First follow-up (T6) → final follow-up (T36) | 21 | -0.0675316194025684 | 0.068127522908121 | -0.991253116506874 | 0.33340396891523 | -0.209643141941677 | 0.0745799031365398 | Not significant at 0.05 |
| Prenatal (T0) → final follow-up (T36) | 21 | -0.00888796425505447 | 0.0725557453299424 | -0.122498421243377 | 0.903726865537269 | -0.160236596902445 | 0.142460668392336 | Not significant at 0.05 |
21 complete records
21 complete within-row DunedinPACE records
All values transcribed from the disclosed source workbook; visit dates are original Excel serial values; original subject identifiers are unavailable.
| Source row | Provisional record label | T0 prenatal | T6 first | T36 final | T6 − T0 | T36 − T6 | T36 − T0 | AddPreg T18 | AddPreg T30 | AddPreg T36 | Visit T0 (serial) | Visit T6 (serial) | Visit T36 (serial) |
|---|---|---|---|---|---|---|---|---|---|---|---|---|---|
| 16 | Record at original worksheet row 16 | 1.29136745435715 | 1.11408653480935 | 1.34663702664913 | -0.1772809195478 | 0.23255049183978 | 0.05526957229198 | 0 | 0 | 0 | 43481 | 43728 | 44733 |
| 18 | Record at original worksheet row 18 | 1.40320165064412 | 1.29812995790129 | 1.56642373052096 | -0.10507169274283 | 0.26829377261967 | 0.16322207987684 | 0 | 0 | 0 | 43476 | 43761 | 44700 |
| 30 | Record at original worksheet row 30 | 1.76542466421321 | 1.88512704015372 | 1.7511786361853 | 0.11970237594051 | -0.13394840396842 | -0.0142460280279102 | 0 | 0 | 0 | 43479 | 43734 | 44781 |
| 40 | Record at original worksheet row 40 | 1.73871454035971 | 1.86505296805408 | 1.72137036098561 | 0.12633842769437 | -0.14368260706847 | -0.0173441793741 | 0 | 0 | 1 | 44022 | 44270 | 45375 |
| 58 | Record at original worksheet row 58 | 1.40562680404706 | 1.80656465275755 | 1.84550152796496 | 0.40093784871049 | 0.03893687520741 | 0.4398747239179 | 0 | 0 | 0 | 44034 | 44276 | 45240 |
| 64 | Record at original worksheet row 64 | 1.36430359835434 | 1.44284129109924 | 1.29626336786567 | 0.0785376927449002 | -0.14657792323357 | -0.0680402304886698 | 0 | 0 | 0 | 43522 | 43846 | 45038 |
| 65 | Record at original worksheet row 65 | 1.73354562148906 | 1.62691633154571 | 1.10863470996392 | -0.10662928994335 | -0.51828162158179 | -0.62491091152514 | 1 | 0 | 0 | 43986 | 44204 | 45346 |
| 83 | Record at original worksheet row 83 | 1.4799582351882 | 1.64547909756918 | 1.56089744311739 | 0.16552086238098 | -0.0845816544517899 | 0.0809392079291902 | 0 | 0 | 0 | 43545 | 43845 | 45030 |
| 94 | Record at original worksheet row 94 | 1.4223366745656 | 1.3698986483646 | 1.27116370944613 | -0.052438026201 | -0.09873493891847 | -0.15117296511947 | 0 | 0 | 0 | 43601 | 43868 | 44869 |
| 97 | Record at original worksheet row 97 | 1.42997406253335 | 1.60773832349709 | 1.23996231961358 | 0.17776426096374 | -0.36777600388351 | -0.19001174291977 | 0 | 0 | 0 | 43543 | 43832 | 44972 |
| 115 | Record at original worksheet row 115 | 1.76640639161502 | 1.6703324453076 | 1.94919038807937 | -0.0960739463074201 | 0.27885794277177 | 0.18278399646435 | 0 | 0 | 0 | 43578 | 43833 | 44837 |
| 117 | Record at original worksheet row 117 | 1.82084447469 | 1.11269175869881 | 1.27264023500571 | -0.70815271599119 | 0.1599484763069 | -0.54820423968429 | 0 | 0 | 1 | 43581 | 43861 | 45040 |
| 121 | Record at original worksheet row 121 | 1.60959791115229 | 1.76262003850657 | 1.52147169152042 | 0.15302212735428 | -0.24114834698615 | -0.08812621963187 | 0 | 0 | 43602 | 43848 | 45152 | |
| 127 | Record at original worksheet row 127 | 1.43859419617928 | 1.72260725299556 | 1.53245697193738 | 0.28401305681628 | -0.19015028105818 | 0.0938627757580999 | 0 | 1 | 0 | 43577 | 43879 | 45109 |
| 137 | Record at original worksheet row 137 | 1.0465185915631 | 0.846132966956673 | 1.24592078200801 | -0.200385624606427 | 0.399787815051337 | 0.19940219044491 | 0 | 0 | 0 | 43641 | 44034 | 45068 |
| 148 | Record at original worksheet row 148 | 1.46618903763794 | 1.29278238002627 | 0.976295143130586 | -0.17340665761167 | -0.316487236895684 | -0.489893894507354 | 1 | 0 | 0 | 43818 | 44092 | 45138 |
| 173 | Record at original worksheet row 173 | 1.54178319244211 | 1.72855502884077 | 2.33435278943669 | 0.18677183639866 | 0.60579776059592 | 0.79256959699458 | 0 | 0 | 0 | 43885 | 44205 | 45220 |
| 201 | Record at original worksheet row 201 | 1.77552850948629 | 1.88735778367768 | 1.52511489951002 | 0.11182927419139 | -0.36224288416766 | -0.25041360997627 | 0 | 0 | 0 | 43837 | 44140 | 45083 |
| 227 | Record at original worksheet row 227 | 1.59994411878604 | 1.77457383801917 | 1.39726951424116 | 0.17462971923313 | -0.37730432377801 | -0.20267460454488 | 0 | 0 | 0 | 43785 | 44077 | 45185 |
| 235 | Record at original worksheet row 235 | 1.35658233793467 | 1.6189861733647 | 1.76161570251002 | 0.26240383543003 | 0.14262952914532 | 0.40503336457535 | 0 | 0 | 0 | 44001 | 44282 | 45321 |
| 250 | Record at original worksheet row 250 | 1.27826227017744 | 1.88774658336816 | 1.32369613836782 | 0.60948431319072 | -0.56405044500034 | 0.0454338681903801 | 1 | 0 | 0 | 44070 | 44328 | 45358 |
All source records
Disclosed DunedinPACE completeness audit — all 264 rows
One row per original worksheet row. No claim that rows are verified unique individuals. Blank source values remain blank.
| Source row | T0 | T6 | T36 | Observed of 3 | Complete all 3? | AddPreg T18 | AddPreg T30 | AddPreg T36 | Visit T0 (serial) | Visit T6 (serial) | Visit T36 (serial) |
|---|---|---|---|---|---|---|---|---|---|---|---|
| 2 | 0 | NO | 0 | 0 | 0 | 43364 | 43621 | 44656 | |||
| 3 | 0 | NO | |||||||||
| 4 | 1.90718808360316 | 1.29303856515381 | 2 | NO | 0 | 0 | 0 | 43363 | 43626 | 44676 | |
| 5 | 1.47362990315169 | 1 | NO | 0 | 0 | 0 | 43382 | 43657 | 44693 | ||
| 6 | 1.55068939202353 | 1 | NO | 0 | 1 | 0 | 43382 | 43648 | 44726 | ||
| 7 | 0 | NO | 0 | 43389 | 43666 | ||||||
| 8 | 0 | NO | 0 | 0 | 0 | 44013 | 44350 | 45236 | |||
| 9 | 0 | NO | |||||||||
| 10 | 0 | NO | |||||||||
| 11 | 1.33060467616186 | 1 | NO | 0 | 1 | 0 | 43389 | 43673 | 44681 | ||
| 12 | 0 | NO | |||||||||
| 13 | 1.63163668771069 | 1.61151597749571 | 2 | NO | 0 | 0 | 43412 | 43668 | 44662 | ||
| 14 | 1.16045712216515 | 1 | NO | 0 | 1 | 0 | 43403 | 43686 | 44693 | ||
| 15 | 1.54630847384287 | 1 | NO | 0 | 0 | 0 | 43987 | 44225 | 45246 | ||
| 16 | 1.29136745435715 | 1.11408653480935 | 1.34663702664913 | 3 | YES | 0 | 0 | 0 | 43481 | 43728 | 44733 |
| 17 | 0 | NO | 1 | 0 | 43488 | 43743 | |||||
| 18 | 1.40320165064412 | 1.29812995790129 | 1.56642373052096 | 3 | YES | 0 | 0 | 0 | 43476 | 43761 | 44700 |
| 19 | 0 | NO | 0 | 44022 | 44257 | ||||||
| 20 | 1.35334775058137 | 1.987567676304 | 2 | NO | 0 | 0 | 0 | 44011 | 44391 | ||
| 21 | 0 | NO | 0 | 43398 | 43668 | ||||||
| 22 | 1.76920483418404 | 1.44191512646978 | 2 | NO | 0 | 0 | 0 | 43371 | 43629 | 44666 | |
| 23 | 1.7640840852526 | 1.39521418671943 | 2 | NO | 0 | 0 | 0 | 43420 | 43693 | 44768 | |
| 24 | 0 | NO | 0 | 0 | 44203 | ||||||
| 25 | 0 | NO | 0 | 43439 | 43676 | ||||||
| 26 | 0 | NO | |||||||||
| 27 | 1.88254024605953 | 1.39212180855621 | 2 | NO | 0 | 0 | 0 | 44176 | 45126 | ||
| 28 | 0 | NO | |||||||||
| 29 | 0 | NO | 0 | 0 | 0 | 43434 | 43720 | ||||
| 30 | 1.76542466421321 | 1.88512704015372 | 1.7511786361853 | 3 | YES | 0 | 0 | 0 | 43479 | 43734 | 44781 |
| 31 | 1.80828958632836 | 1.12512207306648 | 2 | NO | 0 | 0 | 0 | 43403 | 43672 | 44663 | |
| 32 | 0 | NO | 0 | 43438 | 43729 | ||||||
| 33 | 0 | NO | 0 | 0 | 0 | 43406 | 43661 | 44738 | |||
| 34 | 0 | NO | 0 | 0 | 43397 | 43684 | |||||
| 35 | 0 | NO | |||||||||
| 36 | 1.6822171551231 | 1.20862722584997 | 2 | NO | 0 | 0 | 0 | 43440 | 43722 | 44801 | |
| 37 | 0 | NO | 0 | 0 | 43998 | 44257 | 45645 | ||||
| 38 | 0 | NO | 0 | 0 | 43507 | 43806 | |||||
| 39 | 1.72800943654879 | 1.7654184363425 | 2 | NO | 0 | 0 | 0 | 43438 | 43715 | 44793 | |
| 40 | 1.73871454035971 | 1.86505296805408 | 1.72137036098561 | 3 | YES | 0 | 0 | 1 | 44022 | 44270 | 45375 |
| 41 | 0 | NO | |||||||||
| 42 | 0 | NO | |||||||||
| 43 | 0 | NO | 1 | 0 | 0 | 43413 | 43683 | 44673 | |||
| 44 | 0 | NO | 1 | 43495 | 43778 | ||||||
| 45 | 0 | NO | |||||||||
| 46 | 0 | NO | 1 | 43416 | 43728 | ||||||
| 47 | 0 | NO | |||||||||
| 48 | 0 | NO | 43419 | 43699 | |||||||
| 49 | 1.7339029254892 | 1.57857672948797 | 2 | NO | 0 | 0 | 0 | 43412 | 43704 | 44786 | |
| 50 | 1.57077801534898 | 1.26968507548382 | 2 | NO | 0 | 0 | 0 | 43523 | 43819 | 44881 | |
| 51 | 1.3435932700956 | 1.31086876356561 | 2 | NO | 1 | 0 | 0 | 43494 | 43770 | 44816 | |
| 52 | 0 | NO | |||||||||
| 53 | 1.78341568011121 | 1.97877158095772 | 2 | NO | 0 | 1 | 0 | 44022 | 44252 | 45318 | |
| 54 | 1.73021374009259 | 1.57227644152207 | 2 | NO | 0 | 0 | 0 | 43448 | 43724 | 44694 | |
| 55 | 0 | NO | 0 | 0 | 43517 | 43791 | |||||
| 56 | 0 | NO | 0 | 0 | 0 | 43445 | 43714 | 44701 | |||
| 57 | 0 | NO | 0 | 43440 | 43707 | ||||||
| 58 | 1.40562680404706 | 1.80656465275755 | 1.84550152796496 | 3 | YES | 0 | 0 | 0 | 44034 | 44276 | 45240 |
| 59 | 0 | NO | 43511 | 43818 | |||||||
| 60 | 1.35125502999771 | 1.65462218838651 | 2 | NO | 0 | 0 | 0 | 43577 | 43857 | 44862 | |
| 61 | 0 | NO | 0 | 43468 | 43747 | ||||||
| 62 | 1.6517470049759 | 1.27029768767864 | 2 | NO | 0 | 1 | 1 | 43500 | 43805 | 44879 | |
| 63 | 0 | NO | 0 | 0 | 0 | 43481 | 43759 | 44772 | |||
| 64 | 1.36430359835434 | 1.44284129109924 | 1.29626336786567 | 3 | YES | 0 | 0 | 0 | 43522 | 43846 | 45038 |
| 65 | 1.73354562148906 | 1.62691633154571 | 1.10863470996392 | 3 | YES | 1 | 0 | 0 | 43986 | 44204 | 45346 |
| 66 | 1.8412255350943 | 1 | NO | 0 | 0 | 0 | 43479 | 43763 | 44845 | ||
| 67 | 2.04391239720232 | 1.37145993613571 | 2 | NO | 0 | 0 | 0 | 43985 | 44223 | 45204 | |
| 68 | 1.46837739826818 | 1.80010714249337 | 2 | NO | 0 | 0 | 0 | 43474 | 43743 | 44815 | |
| 69 | 0 | NO | 0 | 0 | 0 | 43493 | 43763 | ||||
| 70 | 0 | NO | |||||||||
| 71 | 1.70752879733987 | 1 | NO | 0 | 1 | 0 | 44007 | 44266 | 45244 | ||
| 72 | 1.69917396932334 | 1 | NO | 0 | 0 | 0 | 43565 | 43841 | 44850 | ||
| 73 | 0 | NO | 1 | 43487 | 43775 | ||||||
| 74 | 1.49009585582104 | 1.7055371607303 | 2 | NO | 0 | 0 | 0 | 43497 | 43777 | 44743 | |
| 75 | 0 | NO | 0 | 0 | 0 | 44174 | 45245 | ||||
| 76 | 1.45680535282945 | 1 | NO | 0 | 0 | 1 | 43539 | 43839 | 44841 | ||
| 77 | 0 | NO | 43503 | 43791 | |||||||
| 78 | 0 | NO | 0 | 43530 | 43813 | ||||||
| 79 | 0 | NO | |||||||||
| 80 | 0 | NO | 0 | 0 | 43545 | 43818 | |||||
| 81 | 0 | NO | 43502 | 43810 | |||||||
| 82 | 1.55961270392111 | 1 | NO | 0 | 0 | 0 | 43508 | 43792 | 44886 | ||
| 83 | 1.4799582351882 | 1.64547909756918 | 1.56089744311739 | 3 | YES | 0 | 0 | 0 | 43545 | 43845 | 45030 |
| 84 | 1.54935654513941 | 1 | NO | 0 | 0 | 0 | 43503 | 43768 | 44819 | ||
| 85 | 0 | NO | 0 | 0 | 1 | 43558 | 43843 | 44847 | |||
| 86 | 0 | NO | 0 | 43511 | 43785 | ||||||
| 87 | 1.53097437388713 | 1.08945608470783 | 2 | NO | 0 | 1 | 0 | 43528 | 43808 | 44964 | |
| 88 | 1.51364507175058 | 1.92479737002384 | 2 | NO | 1 | 0 | 0 | 43892 | 44210 | 45243 | |
| 89 | 1.57086404019988 | 1.59643237593163 | 2 | NO | 0 | 0 | 43514 | 43806 | |||
| 90 | 0 | NO | 0 | ||||||||
| 91 | 0 | NO | |||||||||
| 92 | 1.77600144071801 | 1.56882148487819 | 2 | NO | 0 | 0 | 0 | 43992 | 44204 | 45107 | |
| 93 | 0 | NO | |||||||||
| 94 | 1.4223366745656 | 1.3698986483646 | 1.27116370944613 | 3 | YES | 0 | 0 | 0 | 43601 | 43868 | 44869 |
| 95 | 1.39010497522896 | 1 | NO | 0 | 0 | 1 | 43525 | 43789 | 44822 | ||
| 96 | 0 | NO | 0 | 0 | 43517 | 43805 | |||||
| 97 | 1.42997406253335 | 1.60773832349709 | 1.23996231961358 | 3 | YES | 0 | 0 | 0 | 43543 | 43832 | 44972 |
| 98 | 1.75551227988397 | 1.76937467688804 | 2 | NO | 0 | 0 | 44012 | 44314 | |||
| 99 | 0 | NO | 0 | 0 | 44007 | 44293 | |||||
| 100 | 0 | NO | |||||||||
| 101 | 0 | NO | |||||||||
| 102 | 0 | NO | 0 | 0 | 0 | 43993 | 44239 | 45394 | |||
| 103 | 0 | NO | 0 | 0 | 43889 | 44106 | |||||
| 104 | 1.48185156157396 | 1 | NO | 0 | 0 | 0 | 43532 | 43811 | |||
| 105 | 0 | NO | |||||||||
| 106 | 1.66900696185924 | 1 | NO | 0 | 1 | 43585 | 43883 | 45114 | |||
| 107 | 0 | NO | |||||||||
| 108 | 0 | NO | |||||||||
| 109 | 0 | NO | |||||||||
| 110 | 1.85699046875744 | 1 | NO | 0 | 0 | 0 | 43613 | 45153 | |||
| 111 | 1.74019130258563 | 1.60806804798832 | 2 | NO | 0 | 1 | 0 | 43606 | 43892 | 44861 | |
| 112 | 0 | NO | 0 | 0 | 0 | 43594 | 45121 | ||||
| 113 | 0 | NO | 0 | 43601 | |||||||
| 114 | 0 | NO | |||||||||
| 115 | 1.76640639161502 | 1.6703324453076 | 1.94919038807937 | 3 | YES | 0 | 0 | 0 | 43578 | 43833 | 44837 |
| 116 | 0 | NO | |||||||||
| 117 | 1.82084447469 | 1.11269175869881 | 1.27264023500571 | 3 | YES | 0 | 0 | 1 | 43581 | 43861 | 45040 |
| 118 | 0 | NO | 43560 | 43854 | |||||||
| 119 | 1.71692655752752 | 1.81667703249594 | 2 | NO | 0 | 0 | 0 | 43685 | 44021 | 45178 | |
| 120 | 1.45672679524721 | 1.61027951861976 | 2 | NO | 0 | 0 | 0 | 43621 | 43896 | 45086 | |
| 121 | 1.60959791115229 | 1.76262003850657 | 1.52147169152042 | 3 | YES | 0 | 0 | 43602 | 43848 | 45152 | |
| 122 | 1.814103203258 | 1 | NO | 0 | 1 | 43620 | |||||
| 123 | 0 | NO | |||||||||
| 124 | 0 | NO | |||||||||
| 125 | 1.76178551587679 | 1.77694127233279 | 2 | NO | 0 | 0 | 43561 | 43855 | |||
| 126 | 0 | NO | |||||||||
| 127 | 1.43859419617928 | 1.72260725299556 | 1.53245697193738 | 3 | YES | 0 | 1 | 0 | 43577 | 43879 | 45109 |
| 128 | 0 | NO | 0 | 0 | 0 | 43595 | 43869 | 45171 | |||
| 129 | 1.30556723177393 | 1.2903112464996 | 2 | NO | 1 | 0 | 0 | 43682 | 44028 | 45106 | |
| 130 | 0 | NO | 0 | 43614 | 43895 | ||||||
| 131 | 1.85386929451679 | 1 | NO | 0 | 0 | 1 | 44039 | 44286 | 45328 | ||
| 132 | 1.6182355585585 | 1.11205438852568 | 2 | NO | 0 | 0 | 43627 | 44042 | 45096 | ||
| 133 | 0 | NO | |||||||||
| 134 | 0 | NO | 0 | 0 | 43598 | 43876 | |||||
| 135 | 1.81070107669618 | 1 | NO | 0 | 0 | 44249 | |||||
| 136 | 1.32445701067004 | 1.2054859437878 | 2 | NO | 0 | 0 | 0 | 43678 | 44040 | 44876 | |
| 137 | 1.0465185915631 | 0.846132966956673 | 1.24592078200801 | 3 | YES | 0 | 0 | 0 | 43641 | 44034 | 45068 |
| 138 | 0 | NO | 0 | 0 | 43572 | ||||||
| 139 | 0 | NO | |||||||||
| 140 | 0 | NO | |||||||||
| 141 | 0 | NO | 0 | 43630 | |||||||
| 142 | 0 | NO | 0 | 43665 | |||||||
| 143 | 1.50680378359461 | 1.27081863180557 | 2 | NO | 0 | 0 | 0 | 43627 | 44090 | 45084 | |
| 144 | 0 | NO | |||||||||
| 145 | 0 | NO | 0 | 43705 | 44061 | ||||||
| 146 | 1.66524673777437 | 1 | NO | 1 | 0 | 44029 | 44287 | 45233 | |||
| 147 | 0 | NO | |||||||||
| 148 | 1.46618903763794 | 1.29278238002627 | 0.976295143130586 | 3 | YES | 1 | 0 | 0 | 43818 | 44092 | 45138 |
| 149 | 0 | NO | |||||||||
| 150 | 1.39101142304881 | 1 | NO | 0 | 43665 | ||||||
| 151 | 0 | NO | |||||||||
| 152 | 0 | NO | |||||||||
| 153 | 1.3716026871951 | 1.31782323826287 | 2 | NO | 0 | 0 | 0 | 43644 | 45016 | ||
| 154 | 1.74066453774628 | 1 | NO | 0 | 0 | 0 | 43894 | 44252 | 45276 | ||
| 155 | 1.35536798898551 | 1 | NO | 0 | 0 | 0 | 43985 | 44244 | 45124 | ||
| 156 | 0 | NO | 44000 | 44358 | |||||||
| 157 | 0 | NO | 0 | 0 | 0 | 43656 | 44060 | 44907 | |||
| 158 | 0 | NO | 0 | 43626 | |||||||
| 159 | 0 | NO | 0 | 43623 | |||||||
| 160 | 0 | NO | 0 | 0 | 0 | 43876 | 44168 | 45262 | |||
| 161 | 0 | NO | |||||||||
| 162 | 1.37829069803211 | 1.31318978887084 | 2 | NO | 0 | 0 | 43742 | 44075 | 45145 | ||
| 163 | 0 | NO | 43641 | 44091 | |||||||
| 164 | 1.9180199091726 | 1 | NO | 0 | 0 | 0 | 44062 | 44278 | 45346 | ||
| 165 | 0 | NO | 0 | 0 | 43643 | 44056 | 45197 | ||||
| 166 | 0 | NO | |||||||||
| 167 | 0 | NO | |||||||||
| 168 | 0 | NO | |||||||||
| 169 | 1.52674634615641 | 1 | NO | 0 | 0 | 43675 | 43903 | 45018 | |||
| 170 | 0 | NO | 0 | 0 | 43713 | 44096 | |||||
| 171 | 0 | NO | |||||||||
| 172 | 1.335541535688 | 1.86334233020977 | 2 | NO | 0 | 0 | 0 | 43728 | 44097 | 45157 | |
| 173 | 1.54178319244211 | 1.72855502884077 | 2.33435278943669 | 3 | YES | 0 | 0 | 0 | 43885 | 44205 | 45220 |
| 174 | 0 | NO | 0 | 43673 | |||||||
| 175 | 0 | NO | 43742 | ||||||||
| 176 | 0 | NO | |||||||||
| 177 | 0 | NO | 43677 | ||||||||
| 178 | 0 | NO | 43676 | ||||||||
| 179 | 0 | NO | |||||||||
| 180 | 1.28491374453599 | 1.251851818967 | 2 | NO | 0 | 0 | 0 | 43788 | 44086 | 45076 | |
| 181 | 0 | NO | |||||||||
| 182 | 0 | NO | |||||||||
| 183 | 1.64082024056927 | 1 | NO | 0 | 43741 | 44091 | 45078 | ||||
| 184 | 1.58268791069944 | 1 | NO | 0 | 0 | 43754 | |||||
| 185 | 1.3054981520327 | 1 | NO | 1 | 0 | 43901 | 44243 | ||||
| 186 | 0 | NO | |||||||||
| 187 | 1.75685783193247 | 1.90932642715407 | 2 | NO | 0 | 0 | |||||
| 188 | 0 | NO | 0 | 0 | 43717 | 44056 | |||||
| 189 | 1.75070879313232 | 1 | NO | 0 | 43987 | 44276 | |||||
| 190 | 0 | NO | 0 | 43783 | 44085 | ||||||
| 191 | 0 | NO | 0 | 0 | 43836 | ||||||
| 192 | 1.36587091940613 | 1.38638652006601 | 2 | NO | 1 | 0 | 0 | 43895 | 44212 | 45126 | |
| 193 | 1.72631308473958 | 1 | NO | 0 | 0 | 0 | 43986 | 44218 | 45115 | ||
| 194 | 0 | NO | 0 | 43780 | 44202 | ||||||
| 195 | 0 | NO | |||||||||
| 196 | 1.37934050007539 | 1 | NO | 0 | 0 | 0 | 43889 | 44106 | 45166 | ||
| 197 | 0 | NO | |||||||||
| 198 | 1.60138658276966 | 1.28415954830941 | 2 | NO | 0 | 0 | 0 | 43809 | 44105 | 45079 | |
| 199 | 1.68475387145334 | 1.70400186238606 | 2 | NO | 0 | 0 | 0 | 43810 | 44117 | 45092 | |
| 200 | 0 | NO | 0 | 0 | 0 | 43789 | 44216 | 45174 | |||
| 201 | 1.77552850948629 | 1.88735778367768 | 1.52511489951002 | 3 | YES | 0 | 0 | 0 | 43837 | 44140 | 45083 |
| 202 | 1.78516906082799 | 1.65329826249948 | 2 | NO | 0 | 44012 | 44273 | ||||
| 203 | 1.24704960575831 | 1 | NO | 0 | 0 | 43817 | 44114 | ||||
| 204 | 1.89030873599028 | 1 | NO | 0 | 43815 | ||||||
| 205 | 0 | NO | |||||||||
| 206 | 0 | NO | |||||||||
| 207 | 1.60080552865211 | 1.92156333976114 | 2 | NO | 0 | 0 | 0 | 43867 | 44147 | 45160 | |
| 208 | 0 | NO | 0 | ||||||||
| 209 | 0 | NO | |||||||||
| 210 | 1.48679671751068 | 1.75547081876393 | 2 | NO | 1 | 0 | 43808 | 44090 | |||
| 211 | 0 | NO | 0 | ||||||||
| 212 | 1.78140308259875 | 1 | NO | 0 | 1 | 0 | 43987 | 44232 | 45175 | ||
| 213 | 1.46816041218931 | 1.29176117081217 | 2 | NO | 0 | 0 | 0 | 43815 | 44132 | 45211 | |
| 214 | 0 | NO | 0 | ||||||||
| 215 | 0 | NO | 0 | 43990 | 44224 | ||||||
| 216 | 1.91542431884424 | 1 | NO | 0 | 0 | 43888 | 44174 | ||||
| 217 | 0 | NO | 0 | 44305 | |||||||
| 218 | 0 | NO | |||||||||
| 219 | 1.43100971907491 | 1 | NO | 0 | 0 | 44167 | 45112 | ||||
| 220 | 0 | NO | 43761 | 44114 | |||||||
| 221 | 0 | NO | |||||||||
| 222 | 0 | NO | |||||||||
| 223 | 0 | NO | |||||||||
| 224 | 0 | NO | 0 | 43776 | |||||||
| 225 | 0 | NO | 0 | ||||||||
| 226 | 0 | NO | 0 | 0 | |||||||
| 227 | 1.59994411878604 | 1.77457383801917 | 1.39726951424116 | 3 | YES | 0 | 0 | 0 | 43785 | 44077 | 45185 |
| 228 | 0 | NO | |||||||||
| 229 | 1.40594427602873 | 1.69237717744656 | 2 | NO | 1 | 43852 | 44130 | ||||
| 230 | 0 | NO | 1 | 0 | 44007 | ||||||
| 231 | 0 | NO | |||||||||
| 232 | 0 | NO | |||||||||
| 233 | 0 | NO | |||||||||
| 234 | 0 | NO | 0 | 0 | 0 | 43810 | 45201 | ||||
| 235 | 1.35658233793467 | 1.6189861733647 | 1.76161570251002 | 3 | YES | 0 | 0 | 0 | 44001 | 44282 | 45321 |
| 236 | 0 | NO | |||||||||
| 237 | 0 | NO | 1 | 0 | 0 | 43998 | 44253 | 45324 | |||
| 238 | 1.88397659156662 | 1 | NO | 1 | 0 | 0 | 44001 | 44231 | 45404 | ||
| 239 | 1.29955406771391 | 1.74599871384016 | 2 | NO | 0 | 0 | 0 | 44022 | 44258 | 45238 | |
| 240 | 0 | NO | 44230 | ||||||||
| 241 | 1.31800301984156 | 1.84222964076968 | 2 | NO | 0 | 44026 | 44274 | ||||
| 242 | 1.61458155051216 | 1.45227792410713 | 2 | NO | 1 | 0 | 0 | 44043 | 44286 | 45258 | |
| 243 | 1.81782375183961 | 1.70994126174109 | 2 | NO | 0 | 0 | 0 | 44104 | 45386 | ||
| 244 | 1.37312045072524 | 1.60862700289341 | 2 | NO | 0 | 0 | 0 | 44069 | 44310 | ||
| 245 | 1.37973448005857 | 1.70842185214932 | 2 | NO | 0 | 0 | 44069 | 44305 | |||
| 246 | 1.49358630708383 | 1.93283046107 | 2 | NO | 0 | 0 | 44112 | 44371 | |||
| 247 | 0 | NO | |||||||||
| 248 | 1.2796553748113 | 1.77458381131721 | 2 | NO | 0 | 0 | 0 | 44126 | 44423 | 45397 | |
| 249 | 0 | NO | 0 | 44106 | 44404 | ||||||
| 250 | 1.27826227017744 | 1.88774658336816 | 1.32369613836782 | 3 | YES | 1 | 0 | 0 | 44070 | 44328 | 45358 |
| 251 | 1.4352443752734 | 1.90599610083098 | 2 | NO | 0 | 0 | 0 | 44076 | 44317 | 45260 | |
| 252 | 0 | NO | |||||||||
| 253 | 1.50598510659027 | 1 | NO | 0 | 0 | 0 | 44091 | 44394 | 45353 | ||
| 254 | 0 | NO | 44124 | 44419 | |||||||
| 255 | 0 | NO | |||||||||
| 256 | 0 | NO | |||||||||
| 257 | 0 | NO | 0 | 0 | 44134 | 44322 | |||||
| 258 | 0 | NO | 0 | 0 | |||||||
| 259 | 0 | NO | 0 | 0 | 1 | ||||||
| 260 | 0 | NO | 0 | 0 | |||||||
| 261 | 0 | NO | 0 | ||||||||
| 262 | 0 | NO | 0 | 0 | |||||||
| 263 | 0 | NO | 0 | 0 | 0 | ||||||
| 264 | 0 | NO | 0 | ||||||||
| 265 | 0 | NO | 0 |
Published models
Etzel supplemental model coefficients — verbatim source table
Source: mmc3.xlsx, D. Results. Values are published estimate (SE) strings; stars denote source significance markings, not independently calculated p-values.
| Outcome | No interaction: spline 1 | No interaction: spline 2 | No interaction: later pregnancy | Interaction: spline 1 × pregnancy | Interaction: spline 2 × pregnancy | With interaction: spline 1 | With interaction: spline 2 | With interaction: later pregnancy |
|---|---|---|---|---|---|---|---|---|
| aTL | 0.49 (.54) | -0.81 (.37)* | -0.55 (.42) | 0.27 (1.68) | -1.27 (.97) | 0.452 (.57) | -0.58 (.40) | -0.55 (.42) |
| GrimAge | -2.11 (1.06)* | 0.77 (.80) | -0.81 (.76) | -1.06 (3.80) | 2.97 (2.02) | -1.94 (1.11) | 0.21 (.87) | -0.832 (.77) |
| PhenoAge | -2.22 (2.20) | -0.16 (1.64) | -1.17 (1.51) | 5.29 (7.80) | 6.21 (4.21) | -2.47 (2.29) | -1.36 (1.81) | -1.22 (1.51) |
| DunedinPACE | -0.24 (.04)*** | 0.05 (.02) | -0.03 (.03) | -0.04 (.13) | 0.20 (.07)** | -0.23 (.04)*** | 0.01 (.03) | -0.03 (.03) |
Data dictionary
Variables and definitions
The source field names are preserved. Descriptions reflect the available workbook, not an independently verified codebook.
| Field | Meaning | Important qualification |
|---|---|---|
| Source row | Original row number in Trajectories_Data.xlsx | Locator only; not Subject ID/FamID |
| DunedinPACE_T0 | Prenatal DunedinPACE value | Unadjusted disclosed score |
| DunedinPACE_T6 | First follow-up DunedinPACE value | T6 is nominal study label; actual elapsed time may vary |
| DunedinPACE_T36 | Final follow-up DunedinPACE value | T36 is nominal study label; actual elapsed time may vary |
| T6 − T0 | Within-row difference: first minus prenatal | Calculated from source values |
| T36 − T6 | Within-row difference: final minus first | Calculated from source values |
| T36 − T0 | Within-row difference: final minus prenatal | Calculated from source values |
| AddPreg_T18/T30/T36 | Additional pregnancy indicator fields in disclosed source | Do not assume they reproduce published PregAgain_Late variable |
| VisitDate_T0/T6/T36 | Original numeric Excel date serials | Retained as source values; dates not inferred |
| mmc3.xlsx D. Results | Published spline regression coefficient summaries | Not independently replicated from raw individual-level model inputs |
Methods and limits
Reproducibility and interpretive limits
For manuscript / Zenodo readers: provenance and restrictions on inference.
| Item | Description |
|---|---|
| Data source | Etzel et al. (2026), supplementary Trajectories_Data.xlsx and mmc3.xlsx provided with the publication. |
| Source rows | 264 data rows in Trajectories_Data.xlsx (Excel rows 2–265). |
| Selection | Rows where DunedinPACE_T0, DunedinPACE_T6 and DunedinPACE_T36 are all numeric; n = 21. |
| Record linkage | Within-row measurements treated as a provisional longitudinal record. Original participant IDs absent; uniqueness cannot be verified independently. |
| Statistics | For each record, calculate paired change. Mean, sample SD, SE=SD/sqrt(n), t=mean/SE, two-sided Student t p-value (df=20), 95% t CI. |
| Published model comparison | The paired analysis is not a reproduction or refutation of the adjusted nonlinear pregnancy-by-time spline interaction in mmc3.xlsx. |
| Exposure classification | Pregnancy indicators are retained but not recoded to PregAgain_Late because the mapping was not sufficiently documented. |
| Missingness | Complete-record analysis can be affected by selection bias and is not representative of all 264 source rows by assumption. |
| Meaning of nonsignificance | A p-value >0.05 does not prove absence of a biological relationship or equality of groups. |
| Biological inference | A changing methylation-derived score alone does not demonstrate lasting biological deterioration or rejuvenation. |
| No fabricated data | No imputation, guessed participant identities, invented pregnancy labels, or synthetic observations have been added. |
| Reproduction note | This workbook is a documented secondary analysis. The original author-supplied supplementary files should be separately cited and linked, not represented as newly collected data. |
Source workbook: Etzel_2026_Independent_Reanalysis_Zenodo.xlsx. Published model coefficients are reproduced as source strings; they are distinct from the independently recalculated paired comparisons. Original supplementary data remain attributable to Etzel et al.