Volume 1 · Issue 2 · Article 3 · 2026 · Original Research
Foundational Metrology · Human Response Kinetics · Retrospective Study
Measuring Health, Not Disease: Defining the Deep Health Unit Through Human Biological Response, Energy, and Recovery
Evidence from 3,836 Human Participants and 57,540 Antibody Measurements
Bomi Joseph, MD, PhD¹ · ORCID 0000-0001-7626-2734 ↗
Darshana Goakar¹,* · ORCID 0000-0002-2980-9060 ↗
¹ Peak Health Center, San Francisco, California, United States
*Corresponding author: Darshana Goakar, darshana@peakhealth.center
Manuscript finalized: September 2026Submitted: September 22, 2026Published: October 19, 2026
Abstract
Background. Clinical health assessments are typically descriptions of physiological state. We examine whether adaptive performance under a defined perturbation can be expressed quantitatively and propose the Deep Health Unit (DHU), a base-10 logarithmic ratio convention for an operationally specified measure of biological efficiency.
Methods. From a broader archival research population of 11,644, 3,836 participants were selected for this analysis: Healthy (n=1,323), Average (n=1,148), and Poor (n=1,365) recruitment cohorts. The harmonized records contain nominal rabbit-albumin exposure estimates, 15 anti-rabbit-albumin IgG serum observations per participant (post-exposure Days 3–17), two archived skeletal-muscle ³¹P-MRS-derived numerical outputs, and post-exercise phosphocreatine recovery constants. Exact Subject ID and recorded exposure-date correspondence was verified in all six primary exposure/IgG PDFs. The domain-specific efficiency quantity was defined as A_RSA = C_peak/(S₄ × T50); DHU-RSA = log₁₀(A_RSA/A_RSA,ref).
Results. Mean nominal four-session exposures were 12.298, 12.295, and 12.887 ng in Healthy, Average, and Poor cohorts. Mean individual observed IgG peaks were 2,079.95 ± 150.30, 665.94 ± 53.90, and 124.43 ± 18.49 µg/mL. First half-maximum latencies were 7.50 ± 0.10, 9.30 ± 0.11, and 12.53 ± 0.50 days. The MRS-derived resting indices averaged 204.61, 43.11, and 11.19; associated maximal indices averaged 619.18, 120.93, and 31.25. Mean τPCr was 16.21, 40.07, and 63.10 s, respectively. The reanalyzed geometric reference A_RSA,ref was 22.50464 (µg/mL)/(ng·day); resulting mean DHU-RSA values were 0.000, −0.588, and −1.470. All prespecified across-cohort Kruskal–Wallis comparisons of these endpoints had p < 10⁻¹⁶.
Interpretation. Dynamic response magnitude, timing, nominal challenge burden, and recovery can be represented on a reproducible ratio scale under a specified procedure. This study establishes a transparent, antigen-specific reference realization and describes parallel cohort differences in metabolic indices; it does not, by itself, establish a universal whole-person health standard or calibrate any individual commercial device.
KEYWORDS Adaptive biological efficiency; Deep Health Unit; DHU-RSA; biological resilience; antigen response; anti-rabbit-albumin IgG; ³¹P-MRS; ATP turnover; phosphocreatine recovery; metrology; reference realization.
1. Introduction
Health has traditionally been described using disease categories, symptoms, clinical risk, and static observations. Yet an organism can have normal measurements at rest and still differ substantially in the speed, magnitude, coordination, and duration of its response to an unfamiliar perturbation. The central scientific proposition of the Deep Health research program is that adaptive biological performance is itself a measurable physiological property [5,22,26].
The investigators describe adaptation as four linked functions: recognition of a challenge, production of an effective response, delivery of that response to where it is needed, and elimination/recovery toward homeostatic stability. A challenge-and-response experiment is useful because its time axis exposes function that may be invisible in a single cross-sectional measurement. Such an experiment does not require the assertion that one antibody or one metabolic observation captures the totality of health.
Metrology adds a further requirement. A measurand must be defined independently of the instrument eventually used to report it; a reference quantity and measurement procedure must be fixed before results can be compared over time [2,24]. This paper therefore separates the mathematical definition of the DHU from the immune-response experiment that first realizes it and from any later device calibration.

The objectives were to (i) characterize the 15-point immune-response kinetics in 3,836 individually reconciled records, (ii) place these observations alongside archived MRS and PCr recovery measures, (iii) define an unambiguous logarithmic efficiency quantity, and (iv) numerically specify a stable initial reference realization suitable for repeated calculation. The analysis is a quantitative methodological proposal and a retrospective comparison of investigator-reported source cohorts.
2. Study Population, Provenance, and Data Integrity
2.1 Historical research population and selected analysis cohort
The wider Deep Health research program comprised 11,644 participants. A total of 3,836 of those participants (32.9%) were selected for the present study. The original investigations included clinical and physiological research undertaken in San Francisco; the present paper analyzes the experimental records. The three reported study groups are a purposive physiological contrast, not a probability sample of the general population.

| Recruitment stratum | n | Source description | Interpretive role |
|---|---|---|---|
| Healthy | 1,323 | Collegiate varsity and selected professional athletes; screened against evident illness | Positively selected higher-capacity group |
| Average | 1,148 | Community volunteers outside the elite-athlete and recurrent-illness source categories | Intermediate comparison group |
| Poor | 1,365 | Clinical outpatients, including patients with recurrent illness histories | Clinically burdened comparison group |
Table 1. Investigator-described source-cohort composition. These are recruitment labels rather than independently adjudicated diagnostic categories.
2.2 Archive and identifier reconciliation
The investigators report archival preservation of physical and digital records on 4 February 2025, with numerical digitization and transcription review completed in 2026 [6]. In this analysis, the six cohort-specific data were treated as the authoritative paired exposure and IgG representations. Subject IDs identify a unique participant consistently across the matching antigen-exposure and IgG data.
The six data sets contain exactly 3,836 unique Subject IDs, each associated with the same recorded exposure date in the corresponding exposure and anti-RSA IgG record. Within each cohort, all IDs and participant order agree through all three IgG panels (draws 1–5, 6–11, and 12–15). Thus 3,836 × 15 = 57,540 concentration entries were available for kinetic analysis.
The MRS workbook contains those same 3,836 harmonized identifiers. All numerical MRS pairs remain identical, row for row, to the anti-RSA IgG record. The associated τPCr values were carried forward through the historical row-position mapping, as documented in the project reconciliation record [6,8].
| Primary source | Coverage | Fields used in this report |
|---|---|---|
| 3 antigen-exposure sets of measured data | 3,836 unique records | Subject ID; date; airway, hands, systemic, mucosal amounts |
| 3 IgG sets of measured data | 57,540 values | Same IDs/dates; 15 serial concentrations per subject |
| ³¹P-MRS workbook | 3,836 individual pairs | Resting and maximum reported MRS-derived numerical outputs |
| PCr recovery sets of measured data | 3,836 individual constants | Post-exercise τPCr, seconds |
| Methodological reports | Investigator specifications | Spectral ratios, saturation correction, turnover-model definitions |
Table 2. Analytical source inventory. Sets of measured data define the exact exposure/IgG pairing; harmonized identifiers connect all metabolic records.
3. Experimental Procedures and Quantitative Definitions
3.1 Nominal natural rabbit-albumin exposure
According to the investigation, participants underwent natural rabbit-albumin exposure as the source of immunization. Each participant underwent four exposure sessions of 20 minutes on the initial day (80 minutes total). The source table labels the event date “INNOCULATION DATE”; this historical field name is retained for traceability but is not interpreted as evidence of an injected inoculum. Four route descriptors were recorded for a single 20-minute session: airway, hands, systemic, and mucosal, each expressed in nanograms.
The operational four-session external-exposure surrogate used in the analysis is:
S₄,i = 4 × (S_airway,i + S_hands,i + S_systemic,i + S_mucosal,i) [ng]
This assumes that the four recorded fields are additive and that the observed session represents the other three sessions. S₄ estimates nominal external challenge burden, not necessarily retained, bioavailable, or immunologically effective antigen mass. If routes overlap, their sum may overestimate distinct exposure.
3.2 Serial anti-rabbit-albumin IgG concentrations
The outcome is labeled anti-rabbit-albumin IgG concentration, reported in µg/mL. The initial data panel contains draws 1–5, the second draws 6–11, and the third draws 12–15. The investigators’ calendar mapping is Draw 1 = post-exposure Day 3, with daily subsequent observations through Day 17. A numerical pre-exposure IgG baseline is not present in the analyzed 15-point series. All calculated antibody metrics therefore refer to observed post-exposure concentrations, rather than corrected increases above a measured baseline.
For each individual, observed peak concentration C_peak is the largest of the 15 concentrations; observed peak day is the earliest observation attaining this maximum. The response latency T50 is the time of the first ascending crossing of 50% of that individual’s observed peak, linearly interpolated between the two bracketing daily observations. The algorithm allows early fluctuations and does not assume a sigmoidal fitting curve. Day 3 is the earliest observable crossing; with the available data, all subjects yielded a valid later crossing.
T50 = tₖ₋₁ + (0.5 C_peak − Cₖ₋₁) (tₖ − tₖ₋₁) / (Cₖ − Cₖ₋₁)
Here k is the first draw index with Cₖ ≥ 0.5 C_peak and Cₖ₋₁ < 0.5 C_peak. The equation is used only for an ascending crossing with a positive denominator. Other kinetic features—cohort mean time courses and late follow-up values—are reported descriptively. Declining circulating IgG is not identical to confirmed clearance of the antigen or recovery of every organ system.
3.3 Archived purification, electrophoresis and immunoassay workflow
The laboratory account describes serial venous sampling, dialysis, Q Sepharose ion-exchange fractionation, Protein G IgG enrichment, rabbit-albumin immunoaffinity separation, SDS–PAGE, immunoblot confirmation, and ELISA-based immunochemical analysis [9–17]. Reported quality-control steps include multi-point calibration, low/mid/high controls, duplicate assessment, and periodic reanalysis of wells exceeding variation limits. The full transcribed protocols, buffer compositions, and assay thresholds are preserved in Appendix A rather than inferred anew from the modern secondary data files.
These workflows explain the assay context; the present statistical endpoint is the archived numerical concentration series. Original plate readouts, chromatograms, antibody cross-reactivity panels, and specimen-by-specimen calibration histories are contained in the archived summary PDFs. The 15 concentrations are consequently analyzed as reported assay results.
3.4 ³¹P-MRS spectral ratios and historical derived outputs
The investigators used in vivo phosphorus-31 magnetic resonance spectroscopy as an index of tissue high-energy phosphate metabolism [3,4,18]. The accompanying methodological specification distinguishes the dynamic inorganic phosphate-to-phosphocreatine ratio (Pi/PCr) from the resting phosphocreatine-to-ATP ratio (PCr/ATP). The former uses the Pi resonance at approximately +4.8 to +5.0 ppm divided by PCr at 0 ppm; the latter uses PCr divided by the β-ATP resonance near −16 ppm. Each comparison counts one detected ³¹P nucleus in numerator and denominator; no stoichiometric factor of three is required. Differential partial saturation calls for protocol-specific T₁ corrections to the integrated spectral amplitudes [31].
(Pi/PCr)corr = (S_Pi × SF_Pi)/(S_PCr × SF_PCr)
(PCr/ATP)corr = (S_PCr × SF_PCr)/(S_βATP × SF_βATP)
Neither steady-state spectral ratio is itself an ATP production rate. The investigator conversion memorandum describes resting Pi↔ATP magnetization-transfer analysis by selective γ-ATP saturation, with a forward exchange rate constant obtained from apparent T₁ and relative Pi magnetization change. The corresponding tissue-level equation is shown below as part of that model [7,32]:
k_for = (ΔM/M₀)/T₁,app and V_ATP = k_for × [Pi]
For PCr dynamics, resynthesis after controlled exercise is modeled as monoexponential recovery; its time constant τPCr is reported independently in seconds. An estimated initial restoration velocity is V₀ = ΔPCr/τPCr. The investigator methodology further describes an ADP-dependent extrapolation to Vmax [18,28,32]:
PCr(t) = PCr_rest − ΔPCr × exp(−t/τPCr)
V₀ = ΔPCr/τPCr ; Vmax = V₀ × (1 + Kₘ/[ADP]end)
The MRS worksheet contains two numeric columns labeled “Resting Unidirectional Flux” and “Maximal Mitochondrial Capacity.” The later investigator conversion report interprets these as modeled whole-body ATP refresh equivalents using active mass integration and a nominal 250-g standing ATP pool, for example: modeled cycles per day = modeled daily ATP mass turnover / 250 g [32]. This describes the intended physiological translation, not an independently rerun conversion from archived peak integrals or raw spectra. Accordingly, in tables and figures the reported worksheet values are called resting and maximum MRS-derived model indices, with proposed refresh-equivalent units explicitly described as model-based rather than direct primary spectroscopic flux units. They are labeled as measured µmol·g⁻¹·min⁻¹ with supporting calibrations.
3.5 Definition and numerical realization of the Deep Health Unit
A named logarithmic scale is useful for comparing strongly different positive adaptive-response efficiencies while retaining a fixed physical interpretation of ratios. The target construct A is “adaptive biological efficiency”: magnitude of an appropriate response relative to challenge burden and response time, operationally specified for a measurement procedure. In the present antigen-specific realization, three quantities are directly present in the archived numerical data: nominal external challenge, observed serum IgG response magnitude, and latency to half maximum.
A_RSA,i = C_peak,i / (S₄,i × T50,i)
A_RSA has units (µg/mL)/(ng·day) for this experimental protocol. It is an operational response-efficiency index, not an assertion that all components of human health have those dimensions. The proposed DHU is a named base-10 logarithmic ratio quantity, not an SI base unit, and can be used only when the compared A quantities and their reference are operationally compatible [2,23,24].
DHU_RSA,i = log₁₀(A_RSA,i / A_RSA,ref)
A difference of +1 DHU under the same procedure means a tenfold greater A; +0.30103 indicates approximately twofold; −1 denotes one tenth of the reference. Zero denotes equality to the selected reference, not absence of illness or absence of health. Values below the reference can be negative without implying “negative health.”
| DHU difference | Efficiency ratio | Meaning under fixed procedure |
|---|---|---|
| +1.000 | 10.000 × | Tenfold greater operational efficiency |
| +0.301 | 2.000 × | Approximately twice the reference |
| 0.000 | 1.000 × | Reference equality |
| −0.301 | 0.500 × | One half of the reference |
| −1.000 | 0.100 × | One tenth of the reference |
Table 3. Interpretation of the proposed logarithmic DHU ratio convention.
The reference realization used for this, harmonized, analysis is the geometric mean of individual A_RSA values in the 1,323 selected Healthy participants. The reference using the data source and explicitly defined interpolation, is designated RSA-2026.2, superseding the preliminary RSA-2026.1 numeric value in an earlier working manuscript. RSA-2026.2 is fixed at the numerical value stated in the Results. This version discipline permits reproducible comparisons without redefining the old reference after the fact.
3.6 Statistical treatment
Calculations were performed at the participant level, using each person once for peak, timing, dose, MRS indices, τPCr and DHU. Group trajectories represent arithmetic means of individual values for each post-exposure day, with ±1 sample standard deviation shown graphically. The numerical DHU baseline is a geometric mean of positive A values and therefore has a Healthy-group arithmetic mean of log ratios equal to zero by construction. Means and sample standard deviations describe the source cohorts; 95% confidence intervals for selected mean contrasts use Welch’s unequal-variance formulation. Kruskal–Wallis tests summarize three-group differences, with significance interpreted as association across investigator-selected categories, not evidence of random sampling or causality. Exact p values below numerical precision are written as p < 10⁻¹⁶ rather than p=0. All additional ratio interpretations use the same frozen reference.
4. Results
4.1 Exposure burden is of similar magnitude across recruitment strata
Each of the three cohorts contributed a complete set of nominal exposure records. The four-session exposure surrogate averaged 12.298 ± 0.476 ng in Healthy, 12.295 ± 0.573 ng in Average, and 12.887 ± 0.537 ng in Poor participants. Thus the Poor-group mean exposure was approximately 4.8% greater than the Healthy mean, whereas the group difference in peak IgG response was much larger. Large sample size renders even modest distributional differences statistically detectable; the exposures should be described as similar in magnitude, not identical.
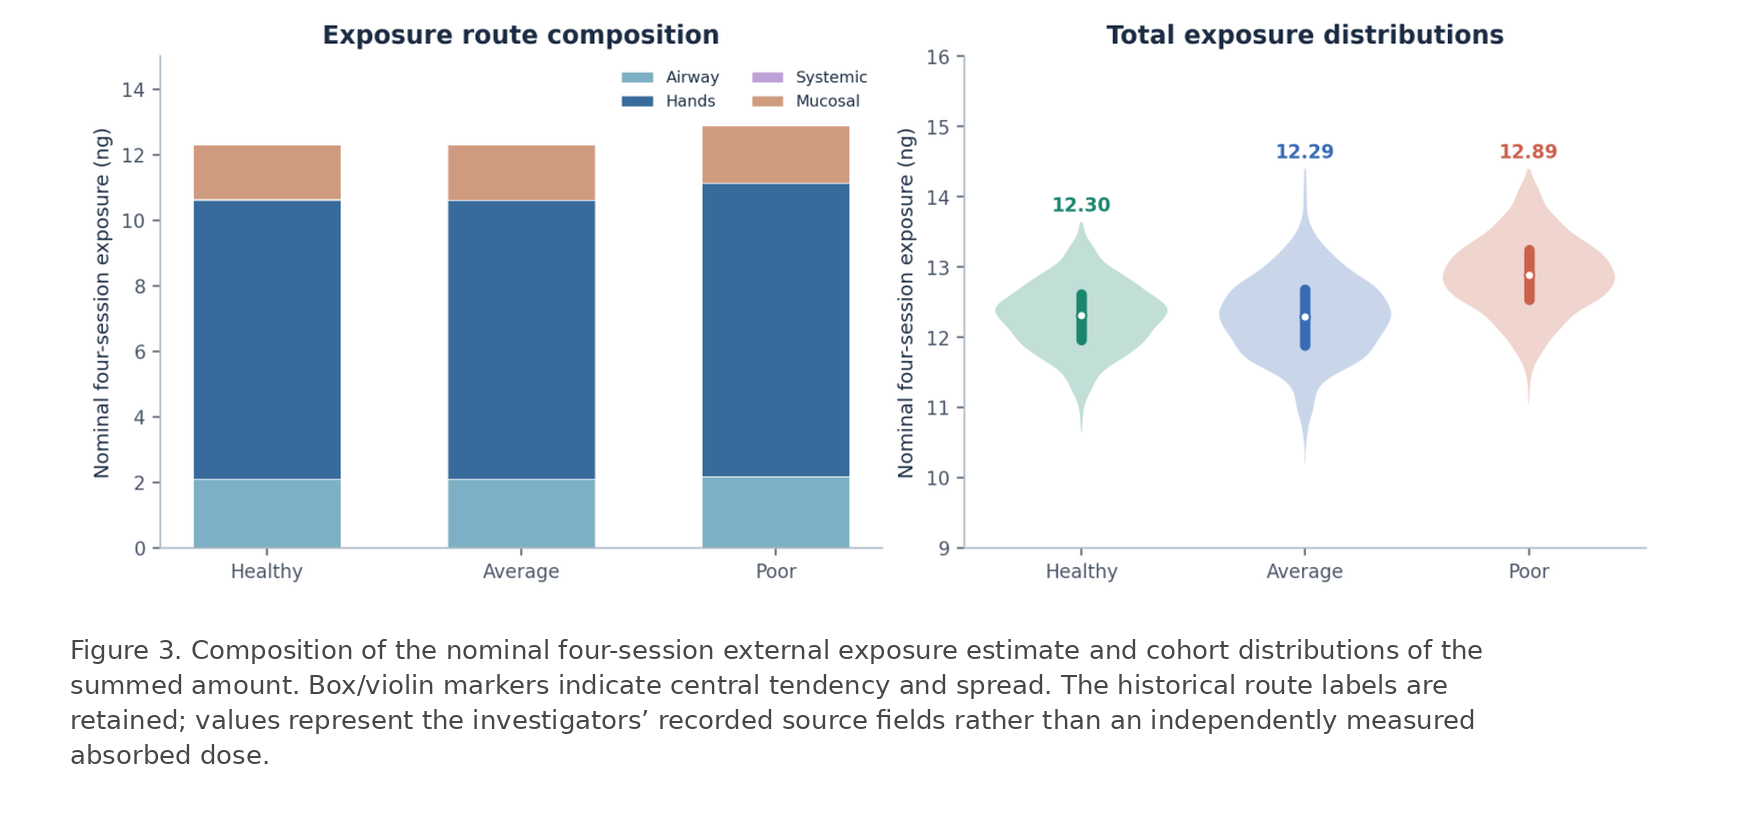
| Exposure field | Healthy (n=1,323) | Average (n=1,148) | Poor (n=1,365) |
|---|---|---|---|
| Airway (ng/20 min) | 0.5283 ± 0.0396 | 0.5281 ± 0.0596 | 0.5483 ± 0.0660 |
| Hands (ng/20 min) | 2.1276 ± 0.1116 | 2.1270 ± 0.1108 | 2.2364 ± 0.1046 |
| Systemic (ng/20 min) | 0.0020 ± 0.0005 | 0.0020 ± 0.0005 | 0.0020 ± 0.0001 |
| Mucosal (ng/20 min) | 0.4166 ± 0.0246 | 0.4167 ± 0.0402 | 0.4351 ± 0.0334 |
| S₄ total (ng) | 12.298 ± 0.476 | 12.295 ± 0.573 | 12.887 ± 0.537 |
Table 4. Nominal external exposure fields and four-session sum; values are participant means ± sample SD.
4.2 Anti-rabbit-albumin IgG trajectories across Days 3–17
Serial sampling yielded 57,540 numeric IgG observations. The Healthy cohort displayed an early transient decrease in mean observed IgG from Day 3 (49.76 µg/mL) to Day 4 (5.00 µg/mL), followed by rapid expansion and a pronounced peak around Days 9–10. The Average group expanded later and remained elevated over more of the observed interval. The Poor group rose slowly to a much smaller and later maximum. These are measured concentration curves: they should not be recast as direct antibody synthesis rates or as proof of complete antigen elimination.
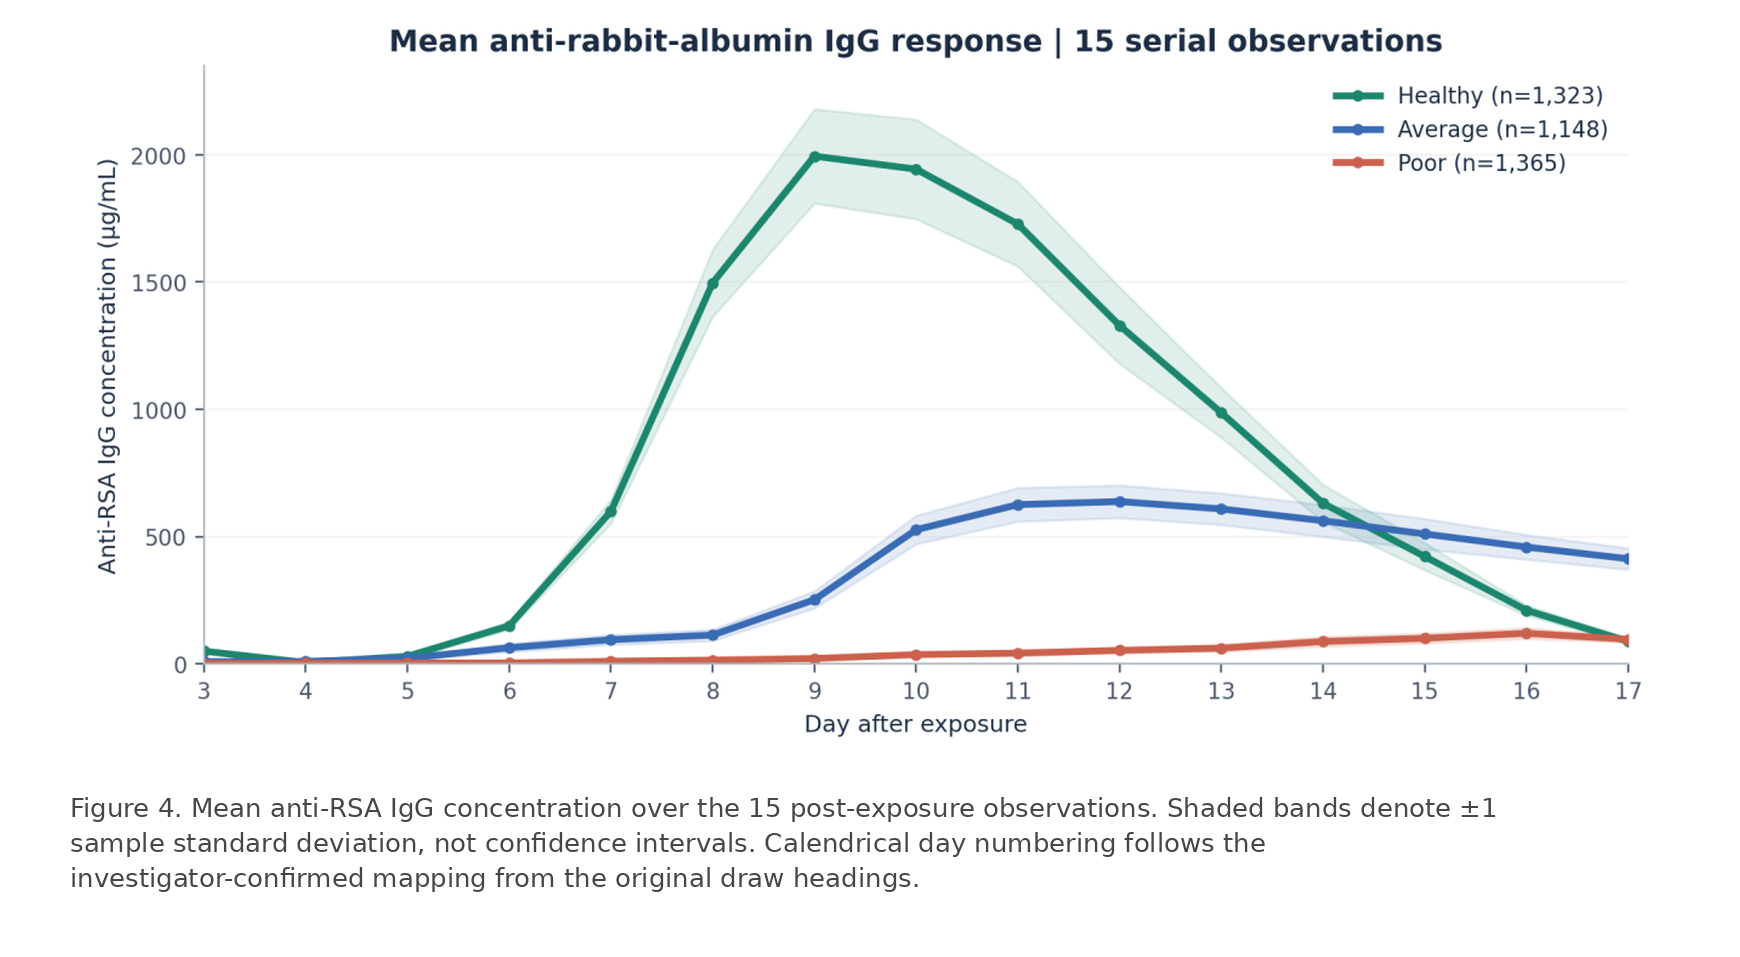
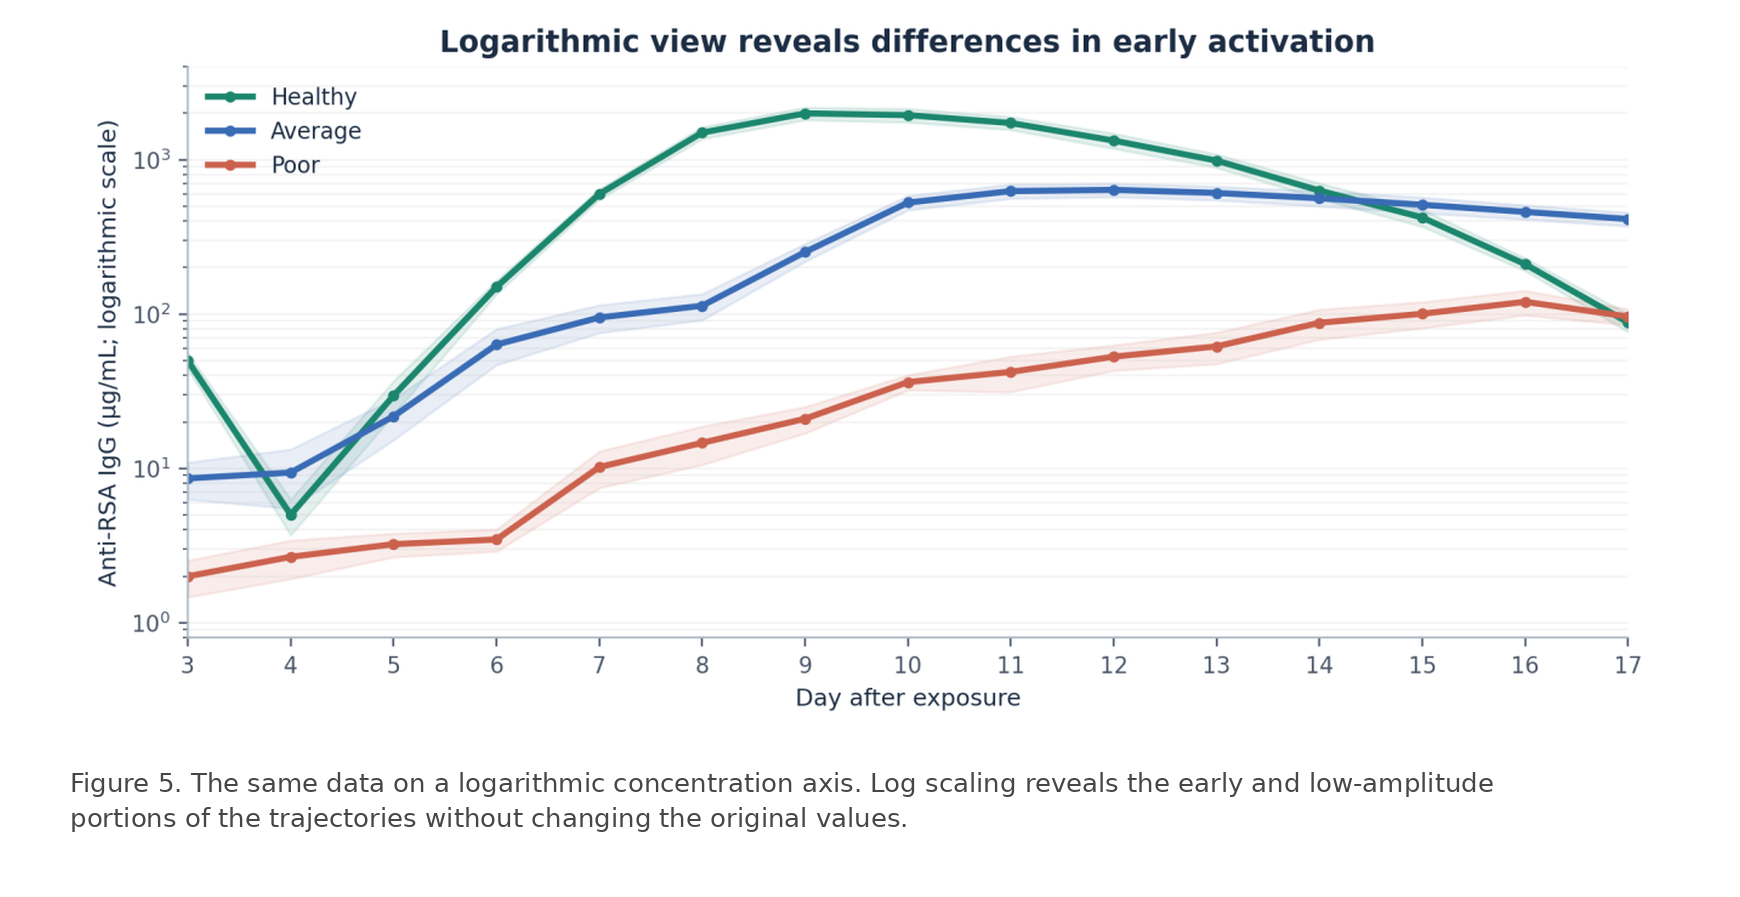
| Post-exposure day | Healthy IgG (µg/mL) | Average IgG (µg/mL) | Poor IgG (µg/mL) |
|---|---|---|---|
| Day 3 | 49.76 ± 5.87 | 8.61 ± 2.31 | 2.00 ± 0.53 |
| Day 4 | 5.00 ± 1.30 | 9.39 ± 3.90 | 2.67 ± 0.75 |
| Day 5 | 29.60 ± 7.27 | 21.74 ± 6.48 | 3.23 ± 0.56 |
| Day 6 | 149.50 ± 15.22 | 63.37 ± 16.58 | 3.46 ± 0.56 |
| Day 7 | 599.00 ± 46.46 | 94.88 ± 19.39 | 10.19 ± 2.72 |
| Day 8 | 1,496.45 ± 131.81 | 113.09 ± 21.79 | 14.63 ± 4.07 |
| Day 9 | 1,994.50 ± 185.26 | 251.98 ± 33.36 | 20.95 ± 4.07 |
| Day 10 | 1,943.44 ± 195.76 | 526.89 ± 56.06 | 36.21 ± 4.07 |
| Day 11 | 1,727.57 ± 166.00 | 625.55 ± 66.17 | 42.17 ± 10.91 |
| Day 12 | 1,328.96 ± 149.93 | 637.55 ± 64.14 | 52.90 ± 9.90 |
| Day 13 | 986.42 ± 97.82 | 608.56 ± 62.14 | 61.67 ± 14.20 |
| Day 14 | 630.78 ± 72.80 | 562.15 ± 62.82 | 87.69 ± 19.30 |
| Day 15 | 421.67 ± 53.23 | 510.25 ± 59.82 | 100.33 ± 19.30 |
| Day 16 | 210.22 ± 19.87 | 458.83 ± 48.40 | 119.95 ± 21.74 |
| Day 17 | 88.21 ± 11.65 | 412.60 ± 42.25 | 96.24 ± 11.49 |
Table 5. Complete 15-day mean ± sample SD concentration series recomputed from the individually matched cohort PDFs.
4.3 Magnitude, latency, peak timing and late-phase response
The mean of each participant’s observed peak was 2,079.95 ± 150.30 µg/mL for Healthy, 665.94 ± 53.90 µg/mL for Average, and 124.43 ± 18.49 µg/mL for Poor participants. Healthy versus Poor peak magnitude differed by a factor of 16.7. The corresponding mean first half-maximum crossing times were 7.50, 9.30, and 12.53 days. The mean of individual observed peak days was 9.49, 11.55, and 15.78 days, respectively. These distinguish amplitude from the time needed to develop that amplitude.
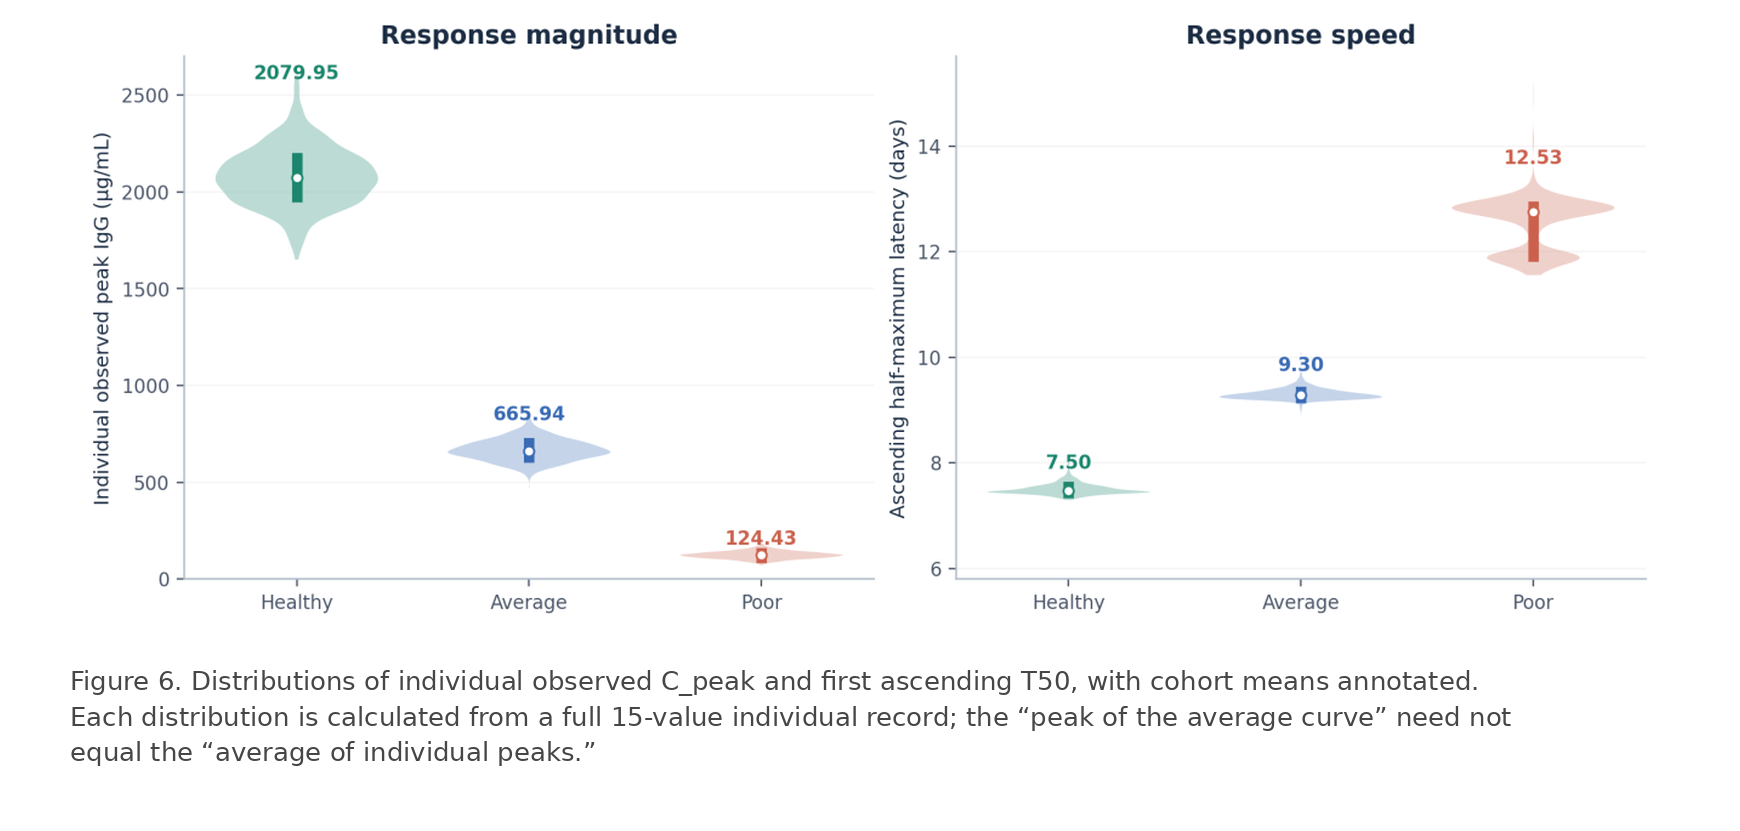

At the last observed day (Day 17), cohort mean IgG concentrations were 88.21, 412.60 and 96.24 µg/mL. In the Healthy group, this represents approximately 4.4% of the maximum of the Healthy mean curve; in Average approximately 64.7%, and in Poor approximately 80.2%. These percentages describe persistence of circulating specific IgG relative to each group’s observed mean trajectory and are not direct measurements of remaining antigen, immune-complex clearance, or general homeostatic restoration.

| Response feature | Healthy | Average | Poor |
|---|---|---|---|
| Individual peak IgG (µg/mL) | 2079.95 ± 150.30 | 665.94 ± 53.90 | 124.43 ± 18.49 |
| Half-maximum latency T50 (days) | 7.50 ± 0.10 | 9.30 ± 0.11 | 12.53 ± 0.50 |
| Individual peak day | 9.49 ± 0.58 | 11.55 ± 0.56 | 15.78 ± 0.45 |
| Day 17 mean IgG (µg/mL) | 88.21 | 412.60 | 96.24 |
| Ratio: Day 17 / peak of mean curve | 4.4% | 64.7% | 80.2% |
Table 6. Participant-level kinetic features and cohort terminal observations. Mean ± SD unless otherwise indicated.
4.4 ³¹P-MRS model indices and phosphocreatine recovery
The unchanged MRS numerical fields display large differences across the three recruitment groups. Resting output averaged 204.61 ± 21.87 in Healthy, 43.11 ± 5.04 in Average and 11.19 ± 2.40 in Poor participants. Maximum output averaged 619.18 ± 60.30, 120.93 ± 14.97, and 31.25 ± 3.89. These are recorded outputs of the investigators’ metabolic model. As primary peak areas, individual T₁ estimates and body-mass scaling parameters are not present in the provided analytic exports, the figures do not treat these outputs as independent spectroscopic flux with a newly certified dimensional unit.
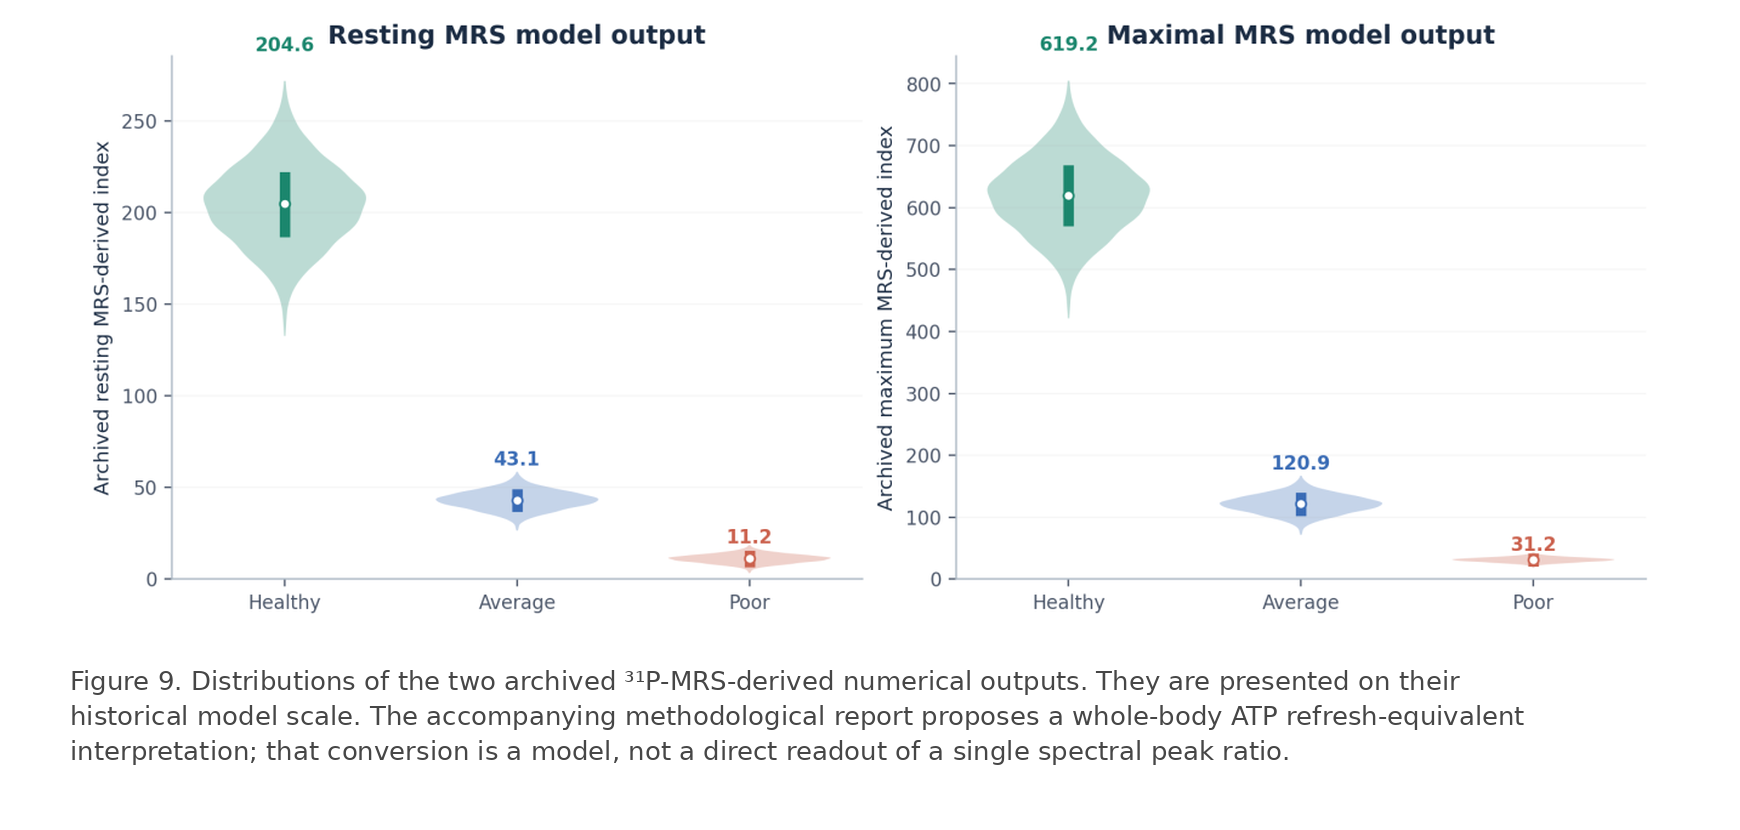
Separately archived PCr recovery constants show longer restoration times for lower-capacity recruitment groups: mean τPCr was 16.21 ± 1.42 s (Healthy), 40.07 ± 4.20 s (Average), and 63.10 ± 7.57 s (Poor). A shorter τPCr under comparable exercise conditions is consistent with faster PCr repletion. The right-hand recovery curves in Figure 10 are *illustrative functions calculated from the group mean τ values*, not additional measured time-series observations.

The pairwise correlation between the archived resting and maximum MRS outputs was r=0.98 in Healthy and r=0.99 (rounded) in Average participants, but r=−0.024 in Poor participants. In the Poor group, maximum index and τPCr correlated positively (r=0.970), unlike the usual simple expectation that faster post-exercise recovery implies greater maximum oxidative capacity. These are properties of the model outputs and merit reporting as such; the manuscript does not infer that all quantities independently validate one another at the individual level.

| Metabolic parameter | Healthy | Average | Poor |
|---|---|---|---|
| Resting MRS-derived index | 204.61 ± 21.87 | 43.11 ± 5.04 | 11.19 ± 2.40 |
| Maximum MRS-derived index | 619.18 ± 60.30 | 120.93 ± 14.97 | 31.25 ± 3.89 |
| PCr recovery constant τPCr (s) | 16.21 ± 1.42 | 40.07 ± 4.20 | 63.10 ± 7.57 |
| Correlation: resting vs maximum | +0.9999 | +1.0000 | -0.0243 |
| Correlation: maximum vs τPCr | -0.0184 | -0.0383 | +0.9997 |
Table 7. Archived MRS numerical outputs and PCr kinetics. All mean ± SD values and within-cohort correlations were recalculated for this report.
4.5 Reference-standard realization and calculated DHU-RSA
The individual-level geometric mean of A_RSA for the Healthy participants was 22.50464106 (µg/mL)/(ng·day). We define this frozen experimental realization as RSA-2026.2. Its 95% interval based on the sampling variation of log(A_RSA), conditional on the selected cohort, was 22.41147–22.59820; this interval does not incorporate assay, exposure-route or historical calibration systematic uncertainty. The resulting cohort means on the DHU-RSA scale were 0.0000 (Healthy), −0.5882 (Average) and −1.4696 (Poor).
A_RSA,ref = 22.50464106 (µg/mL)/(ng·day) [RSA-2026.2]
Re-expressing log means as ratios, the Average and Poor groups had geometric mean efficiencies equal to approximately 25.8% and 3.4% of the Healthy reference, respectively. Relative magnitudes are fixed by the declared logarithmic convention: they are not probabilities of “being healthy,” nor are they percent scores capped at 100%. Any future reporting of DHU in other physiological domains must declare an explicit operational A and reference, rather than assuming units are commensurable by name alone.

| Derived quantity | Healthy | Average | Poor |
|---|---|---|---|
| A_RSA, arithmetic mean ± SD | 22.571 ± 1.740 | 5.833 ± 0.527 | 0.773 ± 0.120 |
| DHU-RSA, mean ± SD | -0.0000 ± 0.0334 | -0.5882 ± 0.0393 | -1.4696 ± 0.0690 |
| Geometric mean ratio to RSA-2026.2 | 1.0000 × | 0.2581 × | 0.0339 × |
| Relative modeled efficiency | 100.0% | 25.8% | 3.4% |
Table 8. Participant-based antigen-specific adaptive-efficiency index and its logarithmic DHU-RSA expression.
4.6 Group inference and magnitude of contrasts
All principal cohort distributions differed strongly on omnibus Kruskal–Wallis tests (each p < 10⁻¹⁶). With n>1,000 in each group, testing alone is not informative about biological importance; the sizes and signs of differences are therefore reported. For example, the Healthy-minus-Poor mean peak IgG contrast was 1,955.52 µg/mL (95% Welch CI 1,947.35–1,963.68); for T50 the contrast was −5.03 days (95% CI −5.06 to −5.00), and for τPCr was −46.89 s (95% CI −47.30 to −46.48).
| Endpoint | H vs Average (mean difference) | H vs Poor (mean difference) | Kruskal–Wallis H |
|---|---|---|---|
| Nominal S₄ (ng) | +0.00 | -0.59 | 861.3 |
| Peak IgG (µg/mL) | +1,414.00 | +1,955.52 | 3,402.1 |
| T50 (days) | -1.80 | -5.03 | 3,402.1 |
| Resting MRS index | +161.50 | +193.42 | 3,402.1 |
| Maximum MRS index | +498.25 | +587.93 | 3,402.1 |
| τPCr (s) | -23.86 | -46.89 | 3,390.0 |
| DHU-RSA | +0.59 | +1.47 | 3,402.1 |
Table 9. Absolute mean contrasts between the Healthy group and two comparison groups; all three-cohort omnibus p values < 10⁻¹⁶. Signs denote Healthy minus comparator.
5. Discussion
5.1 From a health label to a response-defined quantity
The distinctive contribution of this investigation is the operational coupling of a measured perturbation surrogate, a measured response magnitude, and an explicit response time into a dimensioned efficiency quantity, followed by an immutable logarithmic ratio reference. This strategy differs from interpreting a resting analyte threshold, an activity score, or a composite proprietary wellness number as an exhaustive measurement of human health. The DHU proposal specifies what quantity a result is a ratio *of*, how that quantity was calculated, and what one unit means. This supplies a disciplined foundation for future physiological comparisons without conflating definition, biological validation, and instrument calibration.
The study groups exhibit strikingly different response trajectories. The much larger Healthy IgG peak, earlier T50, and later decline demonstrate a reproducible relationship between the investigator-selected source populations and the reported antigen-specific response phenotype. The 16.7-fold Healthy/Poor peak contrast is not explained by an exposure contrast of the same order: the nominal exposure means differ by only approximately 4.8%. Because the selected groups differ in athletic and clinical source, these observations describe a historical cross-cohort contrast, not an unbiased estimate of the distribution of capacity across all adults.
5.2 Physiological interpretation of response and energy kinetics
B-cell activation, clonal expansion, immunoglobulin synthesis, circulation and systemic recovery require coordinated energy and substrate delivery. The lower MRS-derived outputs and slower PCr recovery in the Poor cohort provide a parallel metabolic phenotype consistent with the investigators’ adaptive-capacity framework. The biological relationship, however, is not one-to-one at the individual level in these data. Within each cohort, the correlations between resting MRS output and peak IgG are small (Healthy −0.020; Average −0.019; Poor +0.000), despite very large differences between group means.
The strong association between resting and maximal metabolic indices observed in Healthy and Average participants was absent in the Poor cohort. This finding raises the possibility that impaired physiological health is characterized not only by diminished metabolic capacity, but also by a loss of coordination between basal cellular energy turnover and stimulated metabolic response. The underlying mechanisms require further investigation.
Interpreting phosphorus signals also requires the distinction between concentration ratios, saturation-transfer exchange flux, dynamic PCr recovery, and modeled whole-body ATP refresh equivalents. Peak ratios such as Pi/PCr and PCr/ATP have defined numerator/denominator physics; flux calculations additionally require kinetic and concentration calibration; whole-body extrapolations introduce active-mass and pool-size assumptions [3,4,18,31,32]. Presenting these as a single kind of “ratio” or assigning unverified absolute units to model outputs would weaken the metrological thesis. The revised terminology deliberately keeps the original indexed outputs and measured τPCr separate.
5.3 Why a logarithmic unit—and why a reference matters
A logarithmic ratio scale is mathematically convenient when a biological response-efficiency quantity spans an order of magnitude or more. Under the same procedure and frozen reference, a +1 DHU difference is exactly a tenfold A ratio, independent of the numerical zero chosen. The reference is anchored to a particular laboratory realization (RSA-2026.2), not to an asserted invariant quantity of “perfect health.” This avoids circularly defining a universal human normal value from selected athletes. The reference itself, its procedure, and its provenance must remain versioned and accessible [2,23,24].
The DHU can in principle act as a notation for other operationally defined positive adaptive-efficiency variables, but numerically comparing a DHU constructed from RSA IgG to one constructed from oxygen consumption or muscle recovery requires a separate, empirically validated bridge. Shared logarithmic notation alone does not demonstrate shared measurands. Any sensor system claiming to provide a DHU estimate must establish its mapping to the selected reference and quantify error against the reference method. This is a separate undertaking from proposing the unit.
5.4 Experimental strengths and boundaries of the present realization
The strengths are unusually detailed longitudinal sampling (15 observations per participant), a substantial selected cohort (3,836 people), exposure estimates recorded alongside each participant, paired archival record reconciliation, and independently specified timing/normalization algorithms. Every serum observation in the analysis has a matched Subject ID and an exposure-date record in the six authoritative source data files. The numerical release preserves the cohort definitions and the historical measurements rather than reconstructing unrecorded recruitment events.
The MRS data contains acquisition-level spectra, per-participant relaxation constants and full active-body-mass transformation terms; the subject-linked τPCr workbook contains every original PCr recovery curve, which allows calculation of final recovery constants. The deterministic relation between resting and maximum outputs in two groups, and the positive maximum-index/τPCr correlation in Poor participants, raises the possibility that impaired physiological health is characterized not only by diminished metabolic capacity, but also by a loss of coordination between basal cellular energy turnover and stimulated metabolic response. As mentioned in section 5.2, the underlying mechanisms require further investigation.
The design also has clear boundaries. The source groups were purposefully selected rather than population sampled; pre-exposure numerical IgG concentrations are absent from the analyzed series; the route-specific exposure surrogate depends on assumptions about additivity and session equivalence. The time series ends at Day 17, which prevents a claim of complete antigen elimination or full restoration of organism-wide function. Prior immunologic sensitization, detailed medication histories, and demographic covariates are not contained in the current analytic extracts.
5.5 Prospective significance and instrument independence
The broader scientific program proposed by this paper is a shift from static observations toward standardized, response-defined measures of adaptive function. The immediate advance is an explicit, reproducible analysis of a historical antigen response and a named logarithmic convention capable of expressing its efficiency relative to a fixed reference. The subsequent challenges are cross-domain validation, external replication, normal-range characterization in unselected populations, and metrologically traceable instrument calibration. Those are prospective research activities, not results attributed retrospectively to the present activity.
6. Conclusion
In 3,836 selected participants from a historical research population of 11,644, 57,540 matched serum measurements demonstrate pronounced differences in the magnitude and timing of an antigen-specific response across Healthy, Average, and Poor source groups. The same participants have substantially different archived metabolic model indices and PCr recovery-time distributions. We propose the Deep Health Unit as a logarithmic ratio convention for operationally defined adaptive biological efficiency and numerically realize DHU-RSA using the fixed RSA-2026.2 reference of 22.50464106 (µg/mL)/(ng·day). This specifies a reproducible experimental scale and demonstrates the value of measuring dynamic biological response rather than describing health only through static values. Generalization to whole-organism health, population norms, and clinical device calibration remain separate empirical questions.
Declarations and Data Governance
Funding. Research and retrospective data analysis were supported by Peak Health Center institutional research resources and archival records [6].
Conflicts of interest. Bomi Joseph is an inventor associated with health indices and the Deep Health® Device [5]. Darshana Goakar reports no competing financial interests, as stated in the source manuscript.
Data availability. De-identified source cohorts and their participant-level exposure, serial IgG, ³¹P-MRS model fields, and τPCr numerical archives are retained by Peak Health Center. Six cohort-specific data sets and the metabolic worksheets are the source of the present calculations. Requests for access should be directed to the corresponding author, subject to institutional data-governance controls.
Author contributions. Bomi Joseph conceived the Deep Health metrological framework and the historical research program. Darshana Goakar contributed to data curation, analytical coordination, and manuscript preparation, as described in the original source record. Both authors are responsible for approving the final manuscript prior to submission to the Review Commmittee.
Ethics and provenance. The source work predates the present retrospective manuscript. Institutional study governance, consent documentation, and laboratory provenance are described in the restricted institutional archival record [6]. The present report does not imply a new prospective intervention or newly obtained approvals.
Abbreviations. A_RSA, rabbit-albumin response-efficiency quantity; C_peak, highest measured post-exposure IgG concentration; DHU, Deep Health Unit; DHU-RSA, antigen-specific logarithmic realization; IgG, immunoglobulin G; MRS, magnetic resonance spectroscopy; PCr, phosphocreatine; Pi, inorganic phosphate; S₄, modeled nominal four-session external exposure; T50, latency to first ascending half-maximum crossing; τPCr, PCr recovery time constant.
References
- World Health Organization. Constitution of the World Health Organization. Adopted 1946. https://www.who.int/about/governance/constitution
- Joint Committee for Guides in Metrology. International vocabulary of metrology—Basic and general concepts and associated terms (VIM), JCGM 200:2012. https://jcgm.bipm.org/vim/en/
- Meyerspeer M, Boesch C, Cameron D, et al. ³¹P magnetic resonance spectroscopy in skeletal muscle: experts’ consensus recommendations. NMR in Biomedicine. 2021;34:e4246. doi:10.1002/nbm.4246.
- Kemp GJ, Brindle KM. What do magnetic resonance-based measurements of Pi→ATP flux tell us about skeletal muscle metabolism? Diabetes. 2012;61(8):1927–1934. doi:10.2337/db11-1725.
- Joseph B. Defining and Quantifying Human Health: The Deep Health Unit (DHU) and the Deep Health® Device. Scientific White Paper v1.3. 23 August 2026. Author archive.
- Peak Health Center-origin health measurement: retrospective archival provenance packet, filed October 2026. Restricted organizational archive.
- Joseph B. Quantitative Methodology for Measuring ATP/ADP Refresh Rates: Spectroscopic Profiles, Kinetic Constants, Metabolic Capacities, and Clinical Benchmarks. Unpublished investigator methodology record, provided September 2026.
- Peak Health Center. τPCr Range: individual phosphocreatine recovery-time constants by historical recruitment cohort, n=3,836. Unpublished restricted investigator source workbook, supplied August 2026.
- Engvall E, Perlmann P. Enzyme-linked immunosorbent assay (ELISA). Quantitative assay of immunoglobulin G. Immunochemistry. 1971;8(9):871–874. doi:10.1016/0019-2791(71)90454-X.
- Björck L, Kronvall G. Purification and some properties of streptococcal protein G, a novel IgG-binding reagent. J Immunol. 1984;133(2):969– 974. doi:10.4049/jimmunol.133.2.969.
- Porath J, Axén R, Ernback S. Chemical coupling of proteins to agarose. Nature. 1967;215:1491–1492. doi:10.1038/2151491a0.
- Laemmli UK. Cleavage of structural proteins during the assembly of the head of bacteriophage T4. Nature. 1970;227:680–685. doi:10.1038/227680a0.
- Towbin H, Staehelin T, Gordon J. Electrophoretic transfer of proteins from polyacrylamide gels to nitrocellulose sheets: procedure and some applications. Proc Natl Acad Sci U S A. 1979;76(9):4350–4354. doi:10.1073/pnas.76.9.4350.
- Smith PK, Krohn RI, Hermanson GT, et al. Measurement of protein using bicinchoninic acid. Anal Biochem. 1985;150(1):76–85. doi:10.1016/0003-2697(85)90442-7.
- DeLean A, Munson PJ, Rodbard D. Simultaneous analysis of families of sigmoidal curves: application to bioassay, radioligand assay, and physiological dose-response curves. Am J Physiol. 1978;235(2):E97–E102. doi:10.1152/ajpendo.1978.235.2.E97.
- Shankar G, Devanarayan V, Amaravadi L, et al. Recommendations for the validation of immunoassays used for detection of host antibodies against biotechnology products. J Pharm Biomed Anal. 2008;48(5):1267–1281. doi:10.1016/j.jpba.2008.09.020.
- U.S. Food and Drug Administration. Immunogenicity Testing of Therapeutic Protein Products—Developing and Validating Assays for Anti-Drug Antibody Detection: Guidance for Industry. February 2019. https://www.fda.gov/regulatory-information/search-fda-guidance-documents/immunogenicity-testing-therapeutic-protein-products-developing-and-validating-assays-anti-drug.
- Kemp GJ, Ahmad RE, Nicolay K, Prompers JJ. Quantification of skeletal muscle mitochondrial function by ³¹P magnetic resonance spectroscopy techniques: a quantitative review. Acta Physiol (Oxf). 2015;213(1):107–144. doi:10.1111/apha.12307.
- von Elm E, Altman DG, Egger M, et al. The Strengthening the Reporting of Observational Studies in Epidemiology (STROBE) Statement: Guidelines for Reporting Observational Studies. PLoS Med. 2007;4(10):e296. doi:10.1371/journal.pmed.0040296.
- MacKinnon JG, White H. Some heteroskedasticity-consistent covariance matrix estimators with improved finite sample properties. J Econom. 1985;29(3):305–325. doi:10.1016/0304-4076(85)90158-7.
- Benjamini Y, Hochberg Y. Controlling the false discovery rate: a practical and powerful approach to multiple testing. J R Stat Soc Series B. 1995;57(1):289–300. doi:10.1111/j.2517-6161.1995.tb02031.x.
- Scheffer M, Bolhuis JE, Borsboom D, et al. Quantifying resilience of humans and other animals. Proc Natl Acad Sci U S A. 2018;115(47):11883– 11890. doi:10.1073/pnas.1810630115.
- Bureau International des Poids et Mesures. The International System of Units (SI Brochure), 9th ed., updated 2026. Section on logarithmic ratio quantities. doi:10.59161/AUEZ1291. https://www.bipm.org/en/web/guest/publications/si-brochure
- Joint Committee for Guides in Metrology. International Vocabulary of Metrology (VIM), entry 2.41: metrological traceability. https://jcgm.bipm.org/vim/en/2.41.html
- Collins GS, Moons KGM, Dhiman P, et al. TRIPOD+AI statement: updated guidance for reporting clinical prediction models that use regression or machine learning. BMJ. 2024;385:e078378. doi:10.1136/bmj-2023-078378.
- Huber M, Knottnerus JA, Green L, et al. How should we define health? BMJ. 2011;343:d4163. doi:10.1136/bmj.d4163.
- U.S. Food and Drug Administration. General Wellness: Policy for Low Risk Devices. Final Guidance. January 2026. https://www.fda.gov/regulatory-information/search-fda-guidance-documents/general-wellness-policy-low-risk-devices
- Prompers JJ, Jeneson JAL, Drost MR, et al. Dynamic ³¹P MRS on human skeletal muscle: high-resolution acquisition and fitting of kinetic data. NMR Biomed. 2006;19(2):216–224. doi:10.1002/nbm.1023.
- Chance B, Leigh JS Jr, Clark BJ, et al. Control of oxidative metabolism and oxygen delivery in human skeletal muscle: a steady-state analysis of ³¹P NMR. Proc Natl Acad Sci U S A. 1985;82(24):8384–8388. doi:10.1073/pnas.82.24.8384.
- Lanza IR, Sreekumaran Nair K. Mitochondrial function as a determinant of life span and healthspan. Protein Cell. 2010;1(1):63–69. doi:10.1007/s13238-010-0007-x.
- Peak Health Center. ³¹P Magnetic Resonance Spectroscopy Spectral Ratios: Methodological Specification—Numerators, Denominators, Stoichiometric Scaling, and Saturation Corrections. Unpublished investigator method memorandum, August 2026.
- Peak Health Center. Methodological Conversion and Header Analysis for In Vivo ³¹P-MRS Lab Data: Mathematical Derivation from Spectral Ratios to Whole-Body Refresh Rates. Unpublished investigator methodology record, August 2026.
- Peak Health Center. Cohort-specific antigen-exposure and anti-rabbit-albumin IgG archival data (Healthy, Average, Poor); 3,836 matched Subject ID and exposure-date entries, October 2004–March 2005. Institutional source-data archive.
Appendix A. Detailed Historical Laboratory Procedures
The following laboratory specifications are transcribed and reorganized from the investigator’s historical method account and preserved here to maintain provenance. They are not represented as a new prospective assay validation study.
A1. Sample processing and strong anion-exchange chromatography
The archived protocol describes 12–14 kDa regenerated-cellulose dialysis against 20 mM Tris–HCl (pH 8.0) and 25 mM NaCl at 4 °C with three changes followed by 0.22 µm clarification. Q Sepharose Fast Flow was packed to a 12-mm internal diameter and 100-mm bed height (approximately 11.3 mL). The stated sequence used 10 column volumes (CV) for equilibration, sample loading, and low-salt washing, then a 20-CV gradient from 75 to 400 mM NaCl in 20 mM Tris–HCl (pH 8.0), and a high-salt strip. Nominal fraction volume was 2 mL over the gradient; UV absorbance at 280/260 nm and conductivity were monitored [10,12].
A2. Protein G enrichment and immunoaffinity chromatography
Pooled ion-exchange material was reportedly exchanged into 20 mM sodium phosphate (pH 7.0) and applied to Protein G Sepharose 4 Fast Flow. IgG-containing fractions were eluted with 0.1 M glycine–HCl (pH 2.7) into Tris neutralization buffer. Nominal fraction volume was 1 mL; final eluate pH was reported as 7.0–7.5. Ligand coupling was performed using CNBr-activated Sepharose 4B prewashed in 1 mM HCl, bicarbonate/salt coupling conditions (pH 8.3), glycine blocking, and alternating acetate/Tris washes. Coupling efficiency was reported as 93% [10,11].
A3. SDS–PAGE and purity assessment
The investigator’s SDS–PAGE conditions used 4% stacking/13% resolving gels for reduced material and 4% stacking/7.5% resolving or gradient gels for nonreduced species. Samples were prepared in Tris–glycine/SDS buffer with or without reducing agent; electrophoresis proceeded at approximately 120 V after stacking. Coomassie G-250 and silver staining were used for visual and densitometric purity assessment. Bands near 50 and 25 kDa were consistent with IgG heavy and light chains; 66-kDa albumin-sized and 210–220-kDa nonreducing species were also described [12].
A4. Immunoblot transfer and detection
The laboratory method used wet-tank transfer onto 0.2-µm PVDF at approximately 100 V for 90 min, with Ponceau S transfer assessment, 5% fish-skin gelatin blocking in Tris-buffered saline/Tween, and overnight incubation with primary antibodies to human albumin and human IgG Fc. HRP-labeled goat anti-mouse secondary antibody, ECL, and CCD detection were specified [13].
A5. Antigen ELISA implementation
The archived antigen ELISA method included coating at 2 µg/mL capture reagent in 50 mM carbonate (pH 9.6) overnight at 4 °C, 1% casein blocking, washing with 0.05% Tween-20/PBS, incubation of diluted samples for 1 h at 25 °C, 0.5 µg/mL biotinylated detection reagent, streptavidin–HRP, TMB development for approximately 15 min, and stopping with 0.16 M sulfuric acid. Absorbance was measured at 450 nm with a 620 nm reference [9,15].
A6. Calibration and antibody confirmation
The documented calibration approach used eight nonzero 1:3 dilutions, matrix blanks, anchor points, a four-parameter logistic model weighted by 1/y², duplicate wells, reanalysis when duplicate CV exceeded 20%, and nominal QC targets within 20% (25% at calibration limits). Screening antibody-positive thresholds were derived from 58 baseline negative controls; competitive inhibition confirmation and serial-dilution titration were described [15–17].
Appendix B. Reproducible Endpoint and Reference Algorithms
The analysis is defined in the order below. Let y[i,d] be the archived IgG concentration in µg/mL for subject i on post-exposure day d, where d = 3, …, 17. The criteria can be implemented in any statistical computing language without fitting or imputation.
B1. Record linkage
For each cohort, read every antigen-exposure PDF Subject ID and date; match it to the first IgG panel. Verify that the same ID and row position appears in IgG panels 2 and 3, and concatenate 5 + 6 + 4 serum observations. Reject an unmatched ID, unequal source date, missing panel, or incomplete 15-element row.
B2. Four-session exposure surrogate
S₄[i] = 4 × (airway[i] + hands[i] + systemic[i] + mucosal[i]), in ng. No independently estimated absorbed fraction or correction for route overlap is introduced.
B3. Maximum and time
C_peak[i] = max(y[i,3], …, y[i,17]); day_peak[i] is the earliest day of occurrence. Find the first sample attaining at least 0.5 C_peak and linearly interpolate from the previous sample; define T50 as the interpolated day.
B4. Per-participant efficiency
For each participant, calculate A_RSA[i] = C_peak[i]/(S₄[i] × T50[i]). All denominators must be positive.
B5. Frozen reference
From the 1,323 Healthy participants only, compute log(A_RSA) per participant; calculate A_RSA,ref = exp(mean(log(A_RSA))). Fix the resulting reference as RSA-2026.2 and do not recompute it when adding observations.
B6. Logarithmic result
Compute DHU_RSA[i] = log10(A_RSA[i]/A_RSA,ref). Group means of DHU are arithmetic means of the individually calculated log ratios; they are not logs of group arithmetic mean antibody concentrations.
B7. Descriptive results
Compute sample SD with divisor n−1, the 15 day-specific arithmetic means and SDs, and participant-level peak-day distributions. Use each participant only once in inferential comparisons of summary indices.
Appendix C. Reference Realization and MRS Unit Glossary
| Reported field | Definition and dimension | Reproducibility status |
|---|---|---|
| S₄ | Nominal external challenge, ng per four sessions | Recomputed from four data sets |
| C_peak | Maximum observed anti-RSA IgG, µg/mL | Recomputed from 15 points/subject |
| T50 | Ascending half-maximum latency, days | Linear interpolation, explicitly specified |
| A_RSA | C_peak/(S₄ × T50), (µg/mL)/(ng·day) | Calculated for 3,836 subjects |
| DHU-RSA | log₁₀(A_RSA/A_RSA,ref), dimensionless_ | Calculated; RSA-2026.2 reference fixed |
| Pi/PCr; PCr/ATP | ³¹P spectral peak-area ratios, dimensionless | Formally defined in investigator method document |
| Resting / maximum MRS index | Historical modeled numerical outputs | Unchanged per subject; spectral-to-model conversion not rerun |
| τPCr | Post-exercise PCr recovery constant, s | Reported subject-level constants |
Table C1. Operational data dictionary separating measured, calculated, historically modeled, and reference quantities.
Reference record RSA-2026.2: n_ref = 1,323; baseline = 22.50464106 (µg/mL)/(ng·day), geometric mean of Healthy participant A_RSA values calculated from the harmonized exposure/IgG PDFs. Reference date: October 2026; scope: this defined rabbit-albumin exposure and serum IgG response procedure. The RSA-2026.1 value in the earlier working draft is superseded for this reanalysis, not retroactively substituted into previously reported calculations.